阅读视图

Preface to the Proceedings of RAIL 2025

The sixth workshop on Resources for African Indigenous Languages (RAIL) was held on 10 November 2025 at the CSIR International Convention Centre in Pretoria, South Africa. It was co-located with the Digital Humanities Association of Southern Africa (DHASA) 2025 conference, which took place from 11 to 14 November 2025

  •  

Traditional Readability Approaches in Sesotho and isiZulu

This paper presents a conceptual overview of traditional readability metrics adapted for two South African Indigenous languages, isiZulu and Sesotho, which differ orthographically with conjunctive and disjunctive writing systems, respectively. Both languages are low-resource, lacking extensive corpora, lexicons, and pretrained models necessary for automatic readability assessment. By critically examining these adaptations, we highlight the challenges of applying English-based metrics to morphologically complex African languages and emphasise the need for language-specific digital resources that reflect local linguistic structures. Our work aligns with ongoing efforts to develop and enhance language resources for under-resourced African Indigenous languages, thereby supporting their evolving presence and accessibility in the digital age, including contexts shaped by large language models.

  •  

An exploration of the computational identification of English loan words in Sesotho

South Africa, with its twelve official languages, is an inherently multilingual country. As such, speakers of many of the languages have been in direct contact. This has led to a cross-over of words and phrases between languages. In this article, we provide a methodology to identify words that are (potentially) borrowed from another language. We test our approach by trying to identify words that moved from English into Sesotho (or potentially the other way around). To do this, we start with a bilingual Sesotho-English dictionary (Bukantswe).
We then develop a lexicographic comparison method that takes a pair of lexical items (English and Sesotho) and computes a range of distance metrics. These distance metrics are applied to the raw words (i.e., comparing orthography), but using the Soundex algorithm, an approximate phonological comparison can be made as well. Unfortunately, Bukantswe does not contain complete annotation of loan words, so a quantitative evaluation is not currently possible. We provide a qualitative analysis of the results, which shows that many loan words can be found, but in some cases lexical items that have a high similarity are not loan words. We discuss different situations related to the influence of orthography, phonology, syllable structure, and morphology. The approach itself is language independent, so it can also be applied to other language pairs, e.g., Afrikaans and Sesotho, or more related languages, such
as isiXhosa and isiZulu.

  •  

Mafoko: Structuring and Building Open Multilingual Terminologies for South African NLP

The critical lack of structured terminological data for South Africa’s official languages hampers progress in multilingual NLP, despite the existence of numerous government and academic terminology lists. These valuable assets remain fragmented and locked in non-machine-readable formats, rendering them unusable for computational research and development. Mafoko addresses this challenge by systematically aggregating, cleaning, and standardising these scattered resources into open, interoperable datasets. We introduce the foundational Mafoko dataset, released under the equitable, Africa-centered NOODL framework. To demonstrate its immediate utility, we integrate the terminology into a Retrieval-Augmented Generation (RAG) pipeline. Experiments show substantial improvements in the accuracy and domain-specific consistency of English-to-Tshivenda machine translation for large language models. Mafoko provides a scalable foundation for developing robust and equitable NLP technologies, ensuring South Africa’s rich linguistic diversity is represented in the digital age.

  •  

Multilingual vibes: Visualising linguistic resources and emoji in Southern African online discourse


This article presents Vibes, a prototype interface for visualising multilingual online discourse in Southern Africa. We developed the prototype during a three-day hackathon with a multidisciplinary team. The interface combines computational tools, manual coding and visualisation methods to work with data that standard NLP tools cannot process due to their monolingual design. We tested Vibes on two YouTube datasets: English/isiXhosa comments from the @cmtvsa channel and comments on videos discussing a hair product advertisement controversy. Through this work, we encountered practical challenges, including language identification failures, code-switching within single posts, non-standard orthographies, and multimodal communication through emojis. The challenges led us to propose an interface for collaborative coding that accounts for translanguaging practices. The hackathon development process highlighted the need for context-sensitive tools to study linguistic diversity in the Global South.

  •  

Exploring African Digital Humanities Using the Journal of the Digital Humanities Association of Southern Africa

Digital Humanities scholarship is often framed through paradigms developed in the Global North, leaving African-specific practices and epistemologies underexplored. In this article, I use topic modelling and lexical analysis to investigate what constitutes African DH by analysing 41 Southern African DH articles. The findings indicate that the majority of publications in JDHASA engage deeply with language-related topics. The field combines advanced computational methods with a strong grounding in local languages, cultural heritage, and socio-historical realities. It also reflects responsiveness to evolving digital social realities, addressing themes such as online harm, misinformation, and affective communities. This article contributes to the theorisation of African DH by identifying thematic tendencies and methodological patterns specific to the Southern African context. It highlights the dual focus on computational innovation and cultural rootedness, offering an empirically grounded foundation for further critical engagement with what African DH is and what it can become.

  •  

Attack on Titan (AoT): Anime image dataset for character, scene, emotion recognition and beyond

Data Brief. 2025 Nov 8;63:112246. doi: 10.1016/j.dib.2025.112246. eCollection 2025 Dec.

ABSTRACT

Anime is an influential medium with global popularity, combining visual aesthetics with narrative depth and offering potential applications in content analysis, style transfer, and emotion recognition within computer vision research. Despite its widespread appeal, publicly available anime character datasets remain scarce. To address this gap, we propose the Attack on Titan: Anime Image Dataset, derived from the popular series Attack on Titan, to support anime-focused computer vision research. The dataset comprises 4041 high-quality images divided into 14 classes, each representing a prominent character from the series. These images are manually collected through high-resolution screenshots, capturing a wide range of character poses, expressions, costumes, and backgrounds. The dataset is suitable for various computer vision tasks, including character recognition, emotion detection, style classification, and domain adaptation.

PMID:41399437 | PMC:PMC12702017 | DOI:10.1016/j.dib.2025.112246

  •  

GIS Mapping Taught Through the Theory of Accompaniment

Geographic Information System (GIS) mapping attaches a dataset to a specific space and place, substantiating a relationship between the two as not only directly related but as affected by or moved to that specific point on a map. However, when thinking about how to teach a workshop on mapping to a group, one problem came to mind: we are in a generation with a profound lack of relationship to and with maps and the locations of countries. Which, in general, is its own point of discussion; however, when considering migration and mapping, a recognition of this lack became a focus for me. The question formed: how do I first get people not only to see, but really understand this non-relationship?

As students, we shape our own archives, perceptions, and pedagogy through the scholars we read and encounter. The scholar whose work inspired this very workshop, and answered the questions I wrestled with, is Ana Patricia Rodriguez. I was guided through my approach by both her first monograph, Dividing the Isthmus: Central American Transnational Histories, Literature, and Cultures, and her article, “The Art of (Un)Accompaniment: Salvadoran Child Refugee Narratives in the Twenty-first Century.” (10 out of 10 recommend others read both)

First The Non-Relationship

Rodriquez begins her monograph’s introduction with an activity she runs in her classroom. I pull that activity and use it as my own introduction to not mapping, but maps. The assumption I make is clear- Latin American countries do not and will not register as located within the group’s imagination. The lack is made evident. Now, no spoilers, go read her book. This part of the workshop will use 3D-printed or woodcut materials, is theoretically brief, and allows me to transition from map to mapping by asking them questions. I don’t know what I will ask quite yet, but they will be fantastic questions.

Accompaniment as Pedagogy

Next point of inspiration. First, the question. How can I make a GIS mapping workshop interactive and include a dataset based on migrant experiences in Mexico? Rodriguez’s article introduced me to the work on accompaniment. In this article, her reading of Javier Zamora’s Unaccompanied (also a book everyone should read), theorizes “a poetics of un/accompaniment” where,

The poems create a path of accompaniment of critical empathy for readers to follow literally and literarily the migratory routes of child migrants … It is in this process of accompaniment that readers are positioned, if not prodded, to question the conditions that produce child migration and the legal violence of migration policies, which shape the outcomes of arrival, detention, exclusion, and deportation, especially for women and children.

The accompaniment that Rodriguez traces in Zamora’s works and literature builds on scholarship and research on accompaniment in movements and research, but ties it to migration. Poetry and narratives create a different space for “readers to follow” migrants on their route to the United States. This, along with the ways readers are “positioned, if not prodded, to question the conditions,” prompted me to consider how a hands-on GIS workshop almost inherently, and unintentionally, seeks to enact an accompaniment. This is not to claim that there is a perfect or unflawed relationship between mapping and accompaniment. The accompaniment will shift a bit in its movement to the digital and/or in the making of narratives into data points. However, through accompaniment, what became clear was that what I considered to be simply an inherent relationship between place and data was flawed when I maintained it as inherent rather than as something to be questioned and interrogated.

The reality is that datasets can risk reducing humans to bodies in the very act of transforming information into points plotted on a map. That risk is exacerbated when the lack of relationship to a map is already present, and all a viewer intakes is a map filled with marks, even when they attempt to filter and narrow the scope of what they are looking at. With that, can embedding the mapping of points as a process of accompaniment shift how a viewer or a mapper processes a large, complex dataset? And is this shift my pedagogical framework? No clue, I will get back to you on that one.

The Actual Workshop

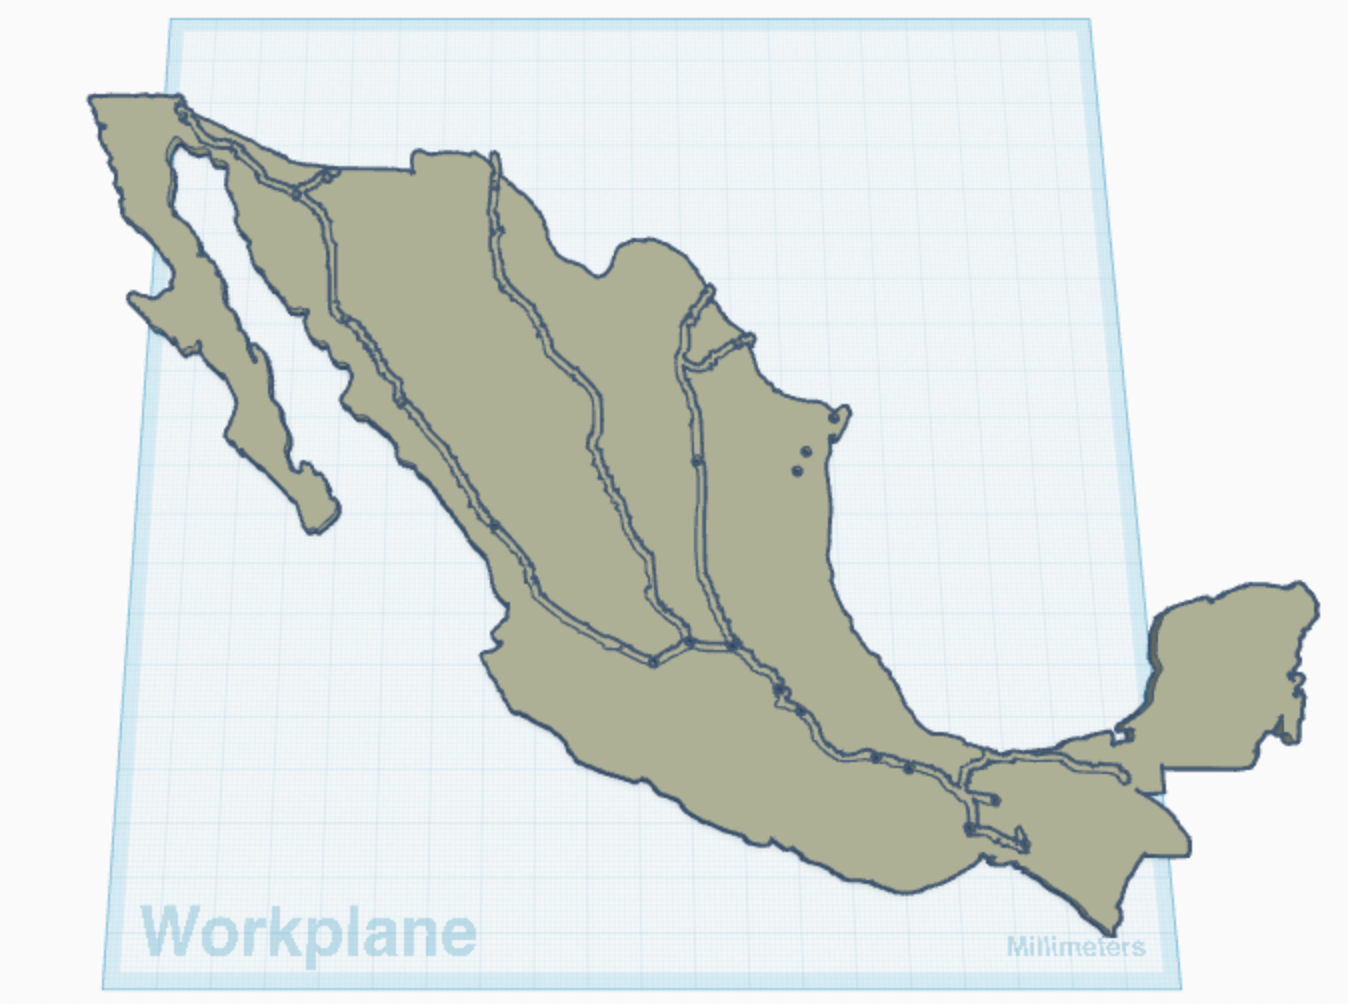
The nitty-gritty part of this actual blog post. Bear with me. In groups, people will be given a 3D-printed or woodcut of México, with holes already embedded into the country. These will be the data points (holes, literally just holes already made in the map) and pins, sized to fit them. The holes are rendered as a permanent facet of the map due to the nature of 3D printing, which makes me consider how the stories and narratives the map represents are always present, whether they are pinned and mapped or not. Which, by no means, should be uncomplicated, we should always consider why data gets mapped, what it is meant to demonstrate, what ends up entering, and what is left out and excluded.

Along with the country, they will also be given a mix of 14 notecards; on the front, each will have a year, the migrants’ nationality, and gender. In a longer workshop, I would leave parts of the data set unlabeled and have participants read the narrative on the other side and fill in the data themselves. Making data collection part of the activity and including a brief interrogation of what we synthesize and ultimately prioritize.

Mexico STL file

Closeup of Mexico STL

STL file for pins

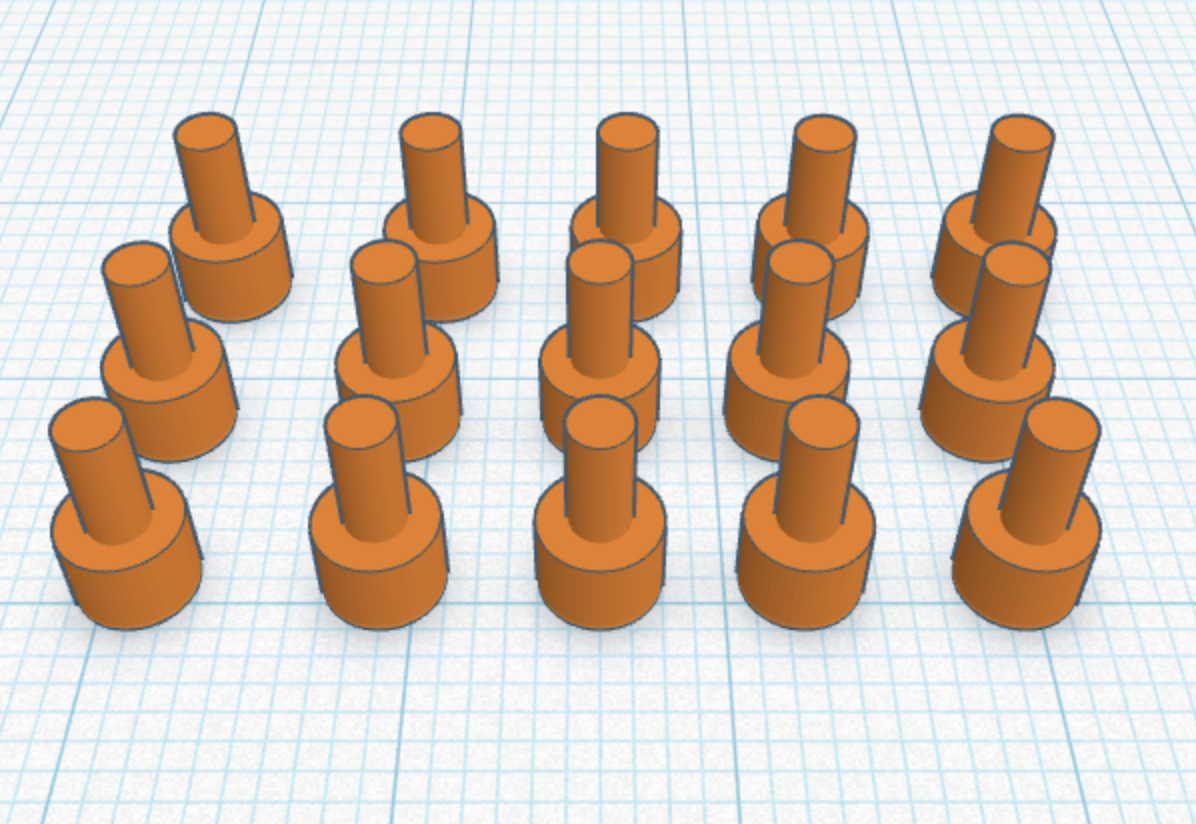
Slowly but surely, they will place a pin on the 3D map at the final location in Mexico mentioned in the narrative, where the hole already exists. By this point, the idea is that each pin they place on the map will serve as an act of accompaniment.

After they finish plotting all the index cards, the hope is that the participant will also be struck by the magnitude and scatter of a map filled with data points everywhere. It is here that the final questions address an essential part of GIS mapping: how does one filter through large datasets? How important were those labels at the front of the card to begin with? How do all the parts work together? Does this data filtering return us to a different directionality of accompaniment? These questions, along with this workshop, are truly a work in progress. While the process of prototyping countries and pins has taught me so many things (like patience and a love of failure), there is still so much I cannot yet estimate. And any comments or suggestions are always welcomed with gratitude.

Finally, I have a big rule about recognizing the role people play in helping me make a chaotic idea from my imagination feel and become tangible. None of this would have been possible without the Makerspace, Ammon, Shane, Brandon, and, lastly, David Coyoca, the man I bother with all my questions about teaching, and who helped me sort through the chaos that is my brainstorming. This final version-in-process would not have been possible without the team effort that praxis encourages. 10 out of 10. Thank you.

References Rodriguez, Ana Patricia. 2009. Dividing the Isthmus: Central American Transnational Histories, Literature, and Cultures. Austin: University of Texas Press

———— 2025 “The Art of (Un)Accompaniment: Salvadoran Child Refugee Narratives in the Twenty-first Century,” Studies in 20th & 21st Century Literature: Vol. 49: Iss. 1, Article 8. https://doi.org/10.4148/2334-4415.2281

  •  

Expertise vs. statistics. A qualitative evaluation of three keyness measures (logarithmic Zeta, Welch’s t-test, and Log-likelihood ratio test) applied to subgenres of the French novel

This paper examines measures of distinctiveness (also known as keyness measures), employing a qualitative, comparative evaluation of three different measures: logarithmic Zeta, Welch’s t-test, and Log-likelihood ratio test.
  •  

Rewiring Digital Humanities through an Ethics of Ecological Care

This paper argues for reorienting Digital Humanities through an ethics of ecological care, challenging its entanglement with extractive infrastructures and techno-solutionism. Drawing on feminist care ethics, postcolonial ecocriticism, and environmental humanities, it calls for rewiring DH practices and pedagogies toward environmental accountability and justice.
  •  

Let the Light in. Using LiDAR- and Photogrammetry-based BIM Reconstruction to Simulate Daylighting in the House of Trebius Valens, Pompeii

Daylight is a crucial element in the architecture of inhabited spaces, but in ancient housing it is often difficult to reconstruct. This article presents a 3D reconstruction of a Pompeian atrium house as the basis for modern daylight simulations. The results shed light on which spaces were usable at different times of day, while the methodology provides a foundation for further analyses of comparable houses
  •