阅读视图

Virtual Readers

Often, the most exciting moment of a Lab project occurs when our research takes an unexpected direction: we thought we were doing 'a', but it turns out that all along we've been doing 'b' (or, more often, should have been doing 'b'). The realization that we've discovered something unexpected, the ability to be guided by the research and its results: these are what differentiates a Lab project from the traditional pursuits of the humanities. And nowhere is this turn more obvious, more frustrating and yet rewarding, than when it occurs at the level of method: when a project whose underlying technology, such as principle component analysis, or sequence matching, proves frustratingly elusive to the data only to suddenly fall into place when one of the project participants points out that our data looks more like something that would respond to, for example, information theory or topic modeling. In such cases, more often than not, we realize that we can now think about the research entirely differently and that what we had expected and hoped to find with our original method is much less interesting than what we now can discover, seemingly by accident.

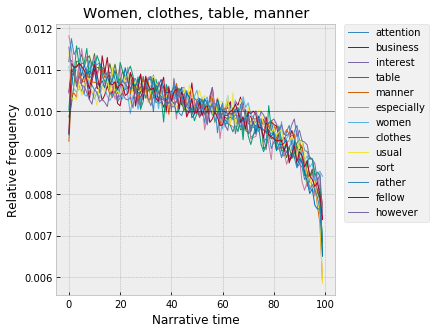
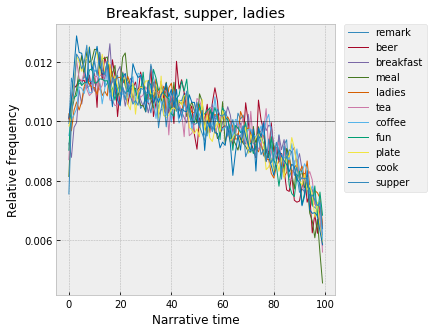
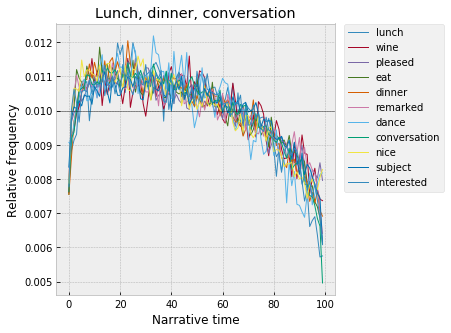
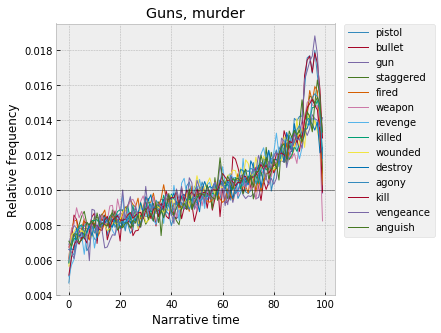
The Lab's project on suspense literature underwent one such reversal midway through our research. Our initial goal in the project was to look for formal features in texts that were associated with the experience of suspense on the part of readers (whether or not they were actually causal), and our initial methods were largely exploratory and heavily informed by our assumptions as to what we might find. In our first attempts, we created features sets (effectively semantic fields) and traced their frequency through the narratives of novels from our hand-assembled suspenseful and unsuspenseful corpora. Despite finding a few promising moments of correlation between various topics and some potentially suspenseful moments in certain narratives (as identified and tagged by readers), we were left stymied by the sheer variety of features and types of suspense. It wasn't until one member of the group suggested (in jest) that it would be much easier if we could use our features to create a suspense detector that the project became clear. We realized that we had been thinking about our data in the wrong way. Rather than create graphs of semantic fields across narratives and try to interpret them ourselves, what if we had a computer create a model based on the patterns that were too subtle for our readerly comprehension? Then we could investigate the choices that it made to identify the patterns that seemed to be indicative of suspense.

This move, from an exploratory, cluster based approach to one predicated on a classification model fundamentally shifted how we saw the project. In the former, the heuristic model is much more familiar to traditional humanities research: the computer transforms the data and then we use our own critical eye to recognize patterns in the data derived from the texts.[1] In the latter, we surrender the reading process to the computer and, by watching how the algorithm makes its decisions as to what a suspenseful passage is and what features indicate its presence, we identify the groups of features, and patterns that we had sought from the beginning. We can then judge these computer derived patterns against our critical knowledge on suspense literature. As an added benefit, the success or failure of the model would also indicate how strongly our selected formal features were indicative of the readerly perception of suspense.[2]

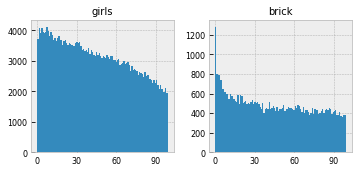
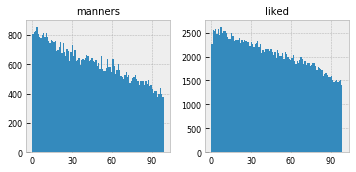
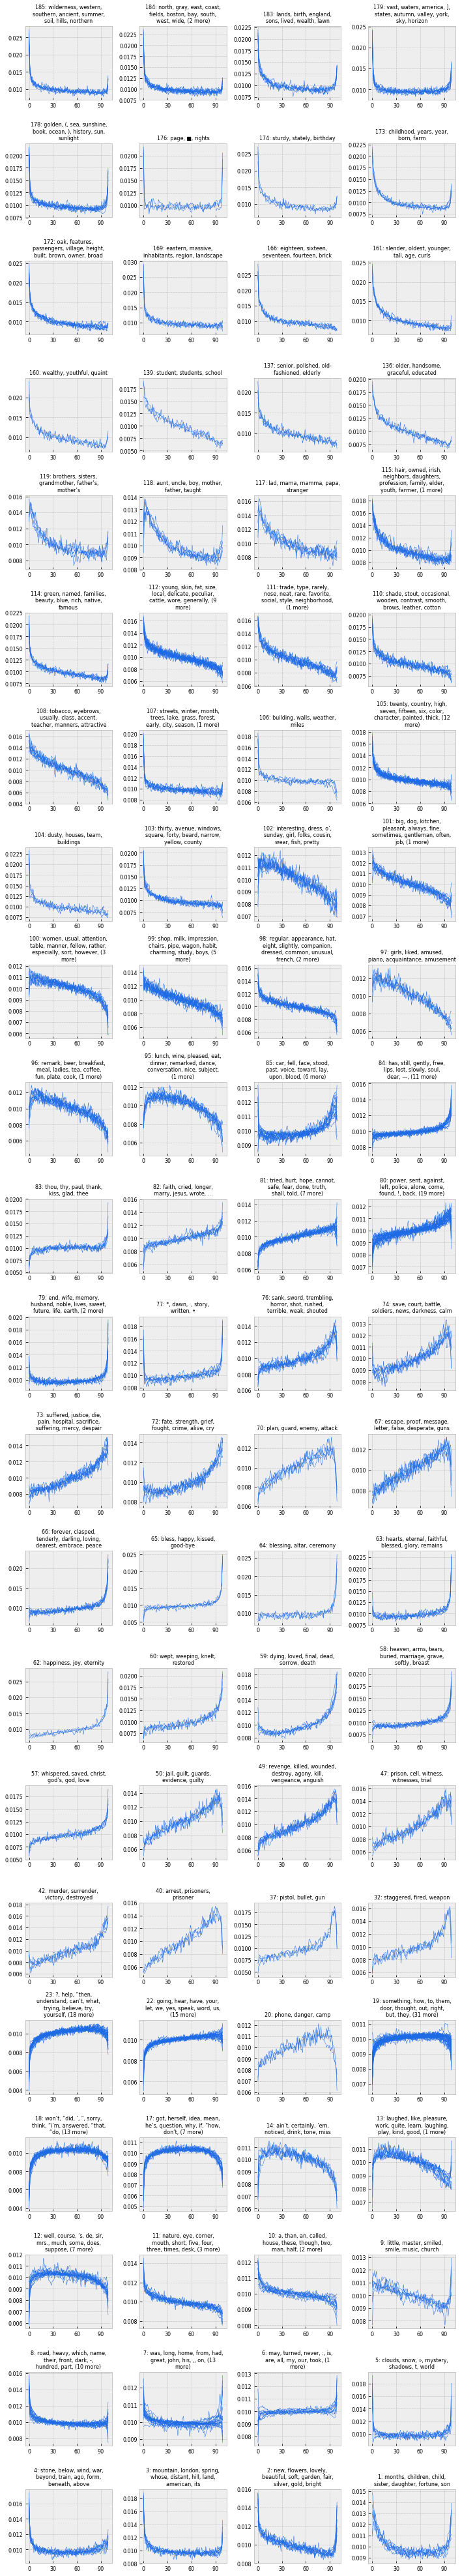
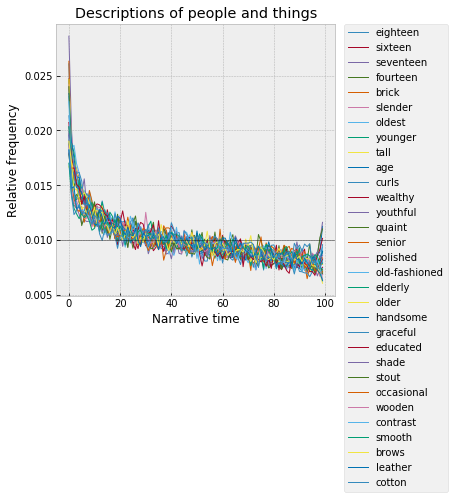
But now that we had decided to make the move from clustering to classification, we were left with a new decision: what classification model would work best, given our somewhat unorthodox data? For our features, we had assembled 87 significantly distributed topics (out of a 150 Gibbs topic model of our suspense and unsuspense corpora), a list of words distinctive of our suspense corpus and a related list of words distinctive of our unsuspense corpus. To this we also added the average age of acquisition (AoA) scores of the texts, and distinctive words of suspense and unsuspense in a smaller short story corpus. We measured each of these fields in over 800 passages that had been hand rated for suspense by a group of readers (our passages were 2% slices of the text in a moving window advanced by 1%).[3] Initially, many more passages had been rated on a scale of 1 to 10 by members of the group, but for this analysis, we only kept those scored below a 3 or above a 7, to create a binary response variable of either 'suspense' or 'unsuspense.' Given our new goal, what we needed was a model capable of combining these features sets, which varied from an average of 23 words per topic field and between 3000 and 4000 for our distinctive word fields, not to mention age of acquisition scores, into a coherent model.

Our first attempts, using the familiar classificatory models of logistic regression, discriminant function analysis (DFA) and support vector machines (SVM), failed. None classified with an accuracy of more than 65% (using a training sample of 75% of our data, cross-validated with a test set of the remaining 25%). In fact, our most successful model was the SVM, which simply classified all of our passages as suspenseful: due to an imbalance in our corpus between the suspenseful and unsuspenseful passages, this resulted in our 65% success rate (or, exactly equal to chance). Clearly, either our initial premise was wrong -- perhaps suspense was entirely located in reader's affect and experience -- or there was some complexity to our variables that resisted these classificatory models. We began to suspect that our features, especially given their diverse origins and unequal sizes, may not combine linearly with our response variables (e.g. a+b+c+d+e...) as the models assume, but may be non-linear (exponential, logarithmic, decaying or chaotic).

It was here that we hit upon the Artificial Neural Network (or ANN). Neural networks have become much more popular in recent large-scale complex modeling (such as Google's deepnet) or in  word vector analysis (such as Word2Vec, where the relationships between the hidden nodes reveal relationships between words). Although our goals were much more straightforward, and our variables were much less complicated, the ANN offered a number of benefits over other classificatory models. Computationally, the advantage of the neural network lies in its ability to handle non-linear models As one of our eventual goals was to increase our feature set with even more diverse variables (measures of volatility, type token ratios, part of speech tags, narrative position, etc), we need our model to account, not just for our present set of variables, but for any that we chose to add in the future, whether continuous, categorical or something else. From a critical standpoint, too, the psudeo-cognative structure of the neural network suggested an intriguing resonance with the reader-focused aspect of the project: in it, we could combine all of the experiences of our group of readers as we trained a new, comprehensive virtual reader, whose actions we could observe, record and analyze.

There are, however, a few detriments to using an ANN in this way. First, it comes with a much greater computational overhead than the other classificatory algorithms that I listed above. This overhead makes sense when working with the extremely large data sets that deep learning neural networks have become famous for (millions of images, or billions of words). Any additional overhead in these cases is utterly dwarfed by the size of the data (when you are working with petabytes of data, a few extra megabytes in the model is meaningless). Also, neural networks are the ultimate black boxes: peering beneath the hood reveals the weighting system among the hidden layers of nodes, but, unlike logistic regression, for example, it does not reveal a one-to-one correspondence between a variable and its importance to the classification. Nevertheless, even when taking these into consideration, the advantages of the ANN outweighed the detriments and we set out to train a neural network to identify suspense.

For our initial attempt, I created a set of neural networks using Fritsch and Guenther's package neuralnet in R (https://cran.r-project.org/web/packages/neuralnet/neuralnet.pdf). Although the package allows for the relatively straightforward creation of neural networks trained through backpropagation with the neuralnet() function, it was more expedient to create a set of wrapping functions for training an ANN with the package that could easily be deployed using our data:

This function takes a training set (raw.data), a withheld test sample (test.set) and a vector of column identifiers for both the input features (variable.vec) and the response variables (output.var). The response variables expected by the neural net packages in R are different when compared to other classification models: the neuralnet package expects and classifies on one or more continuous variables. The flag cat=T calls the class.ind() function from a separate package (nnet), which converts a single categorical variable into a binary matrix, where the columns correspond to the levels of the categorical variable as a factor and each row contains a 1 in its corresponding column. In other words, the function converts a single categorical response variable to some number of binary response variables based on how many categorical values were in the initial variable (in this case, 2: suspense and unsuspense). Note that in the training step, the error handling of the function allows the model to fail: this often occurs when the model converges to a local, rather than global, minimum.

The wrapping function above does not just create a neural network model, it also cross-validates that model against the withheld test sample with the function netClass():

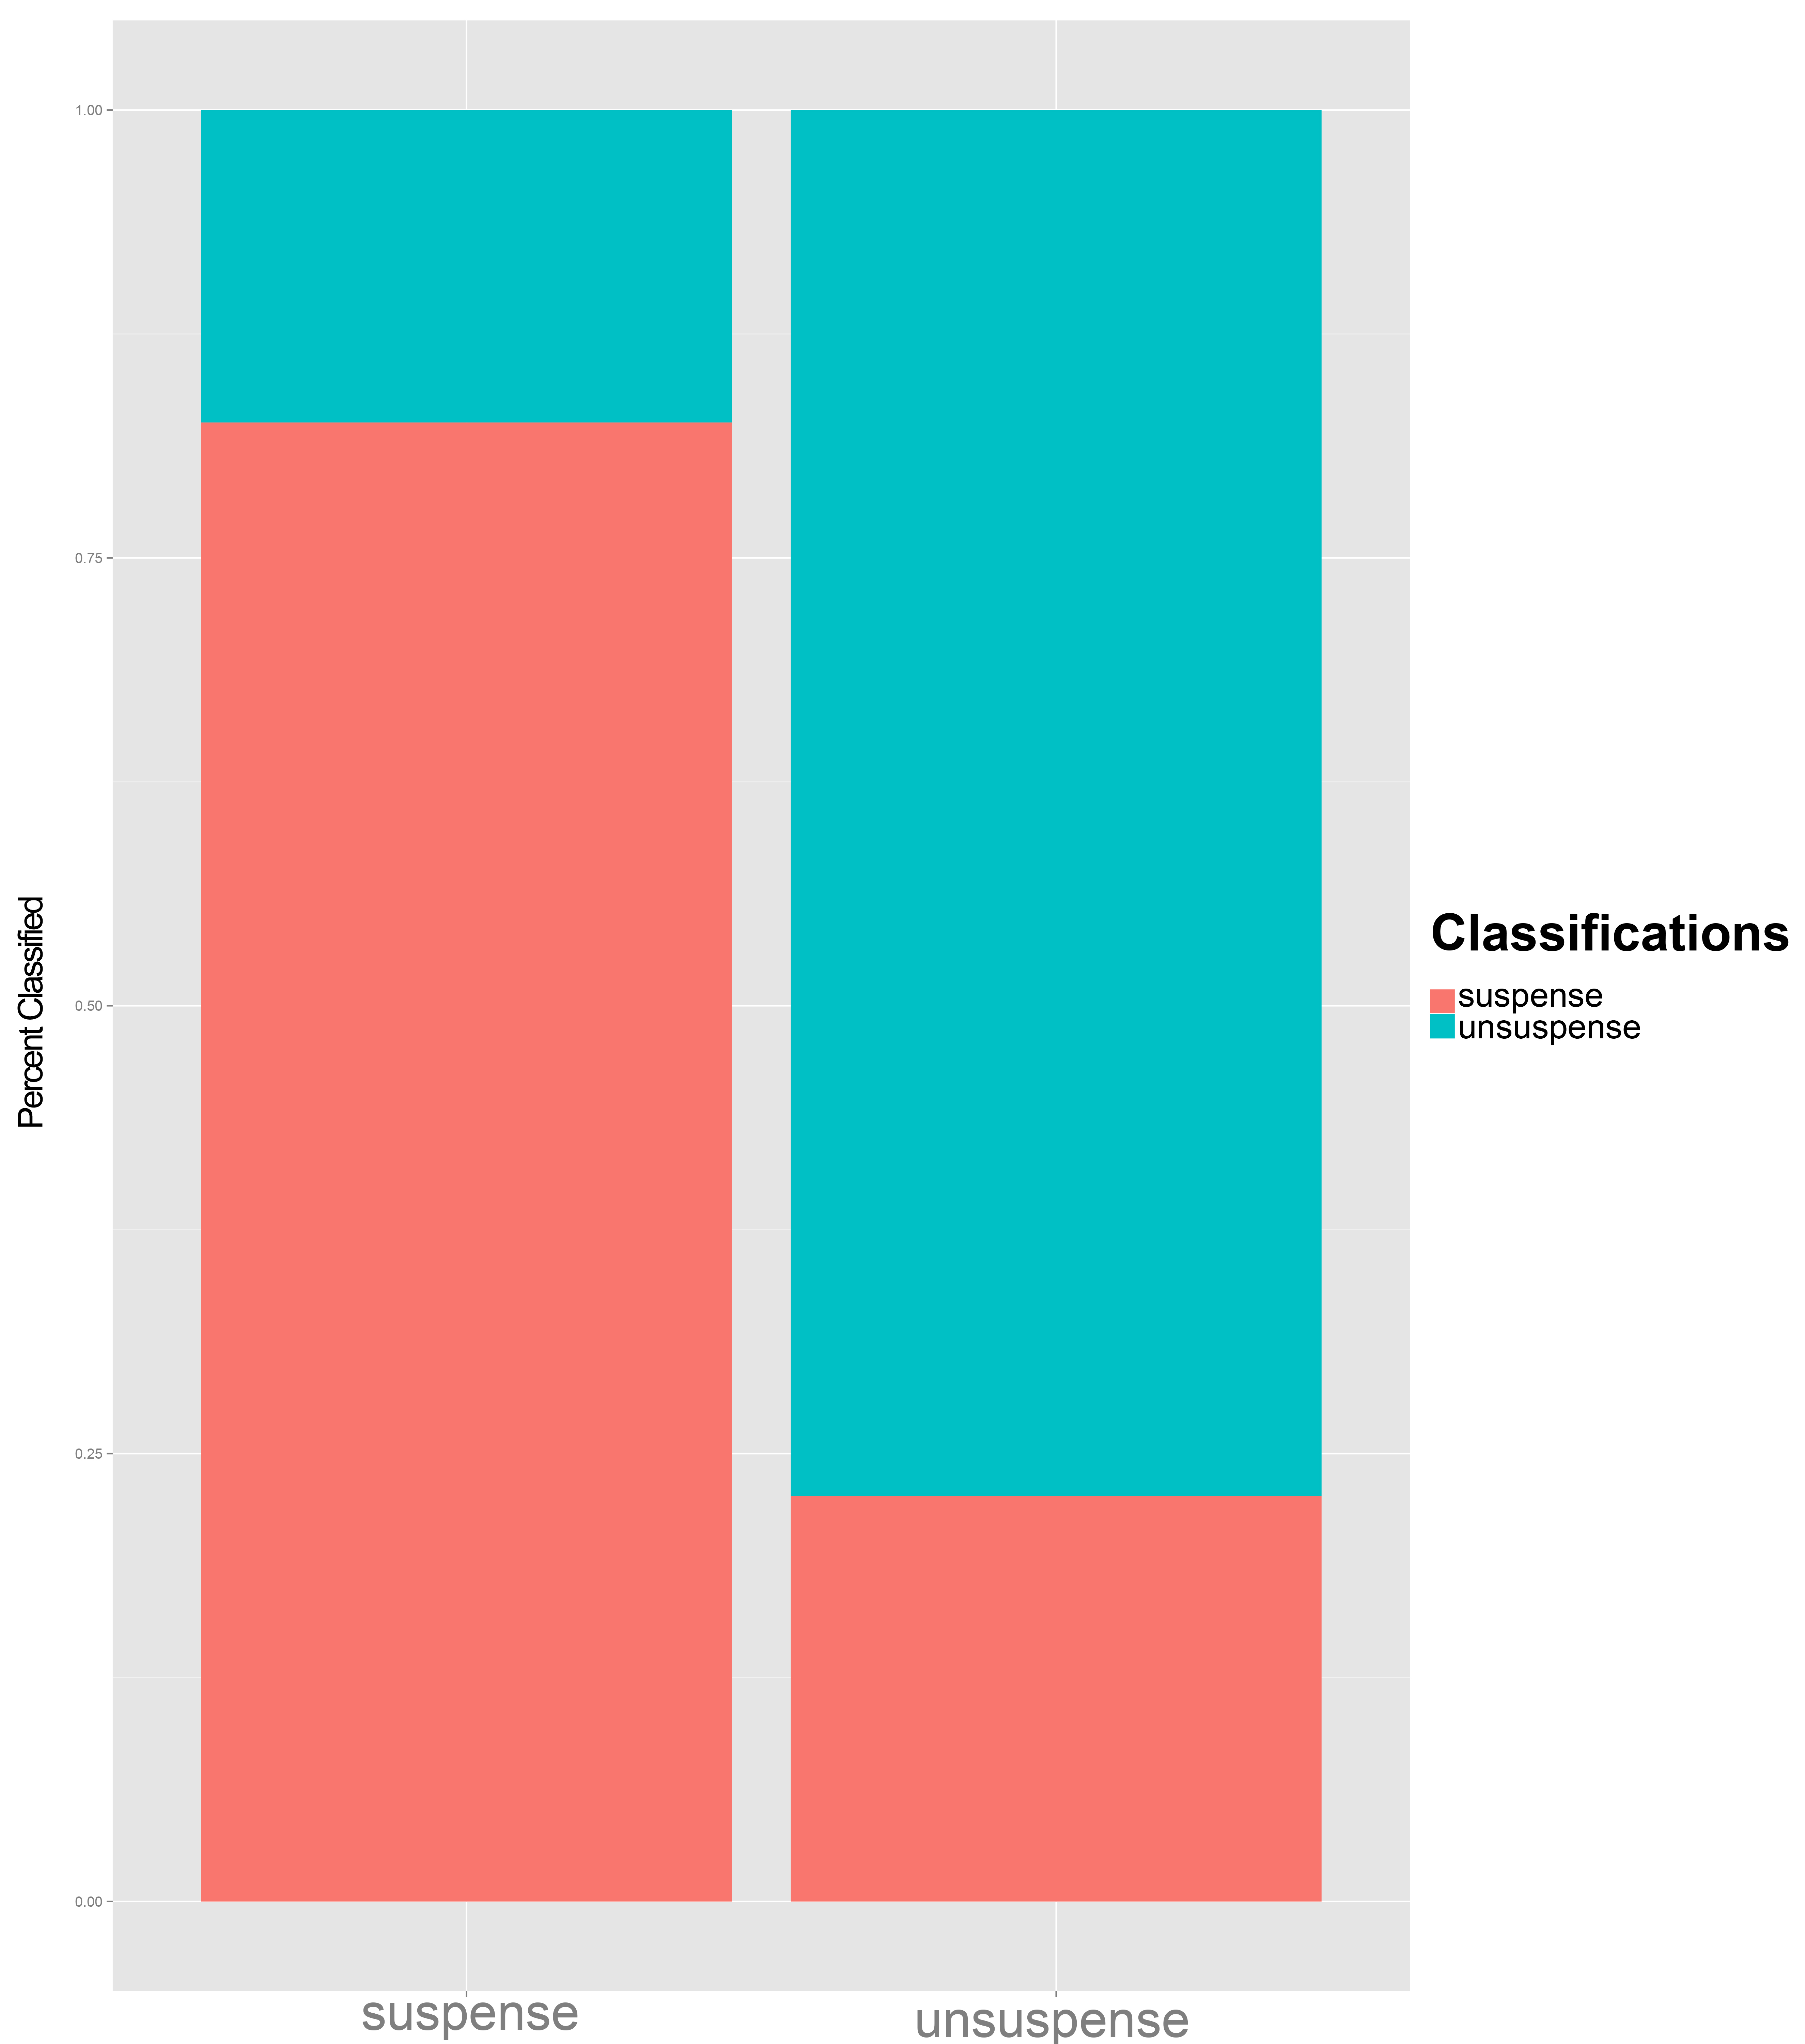
The function netClass takes a trained ANN model, a withheld test sample, and a set of correct class assignments. After validating the model by classifying the test sample against the known assignments, it returns the overall error rate for the validation, as well as a classification table and a confusion plot showing the relative classification success for each class. These are returned as part of the output list, along with the trained model, by the trainNeuralNet() function.

Like a topic model that requires a pre-established number of topics, the neuralnet package requires a pre-determined internal structure: some number of hidden levels, each with some number of hidden nodes per level. The training process assigns weights to these nodes, but the actual numbers are fed to the algorithm when it is initialized, here through a vector the same length as the number of hidden levels; the values of each element indicate the number of hidden nodes per level.[4] Determining the number of nodes is highly subjective, particularly for a shallow ANN with a relatively small data set (886 scored passages in our initial sample). In our project, then, we created a series of backpropagation-trained ANNs, varying the number of levels between 1 and 4 and the number of nodes per level between 5 and 8. We iterated each level and node combination 5 times and averaged the error statistics across the iterations (creating, in total, 420 different models). These relatively small networks offered, at least initially, better results than much larger networks, and the small size allowed us to create and store a number of iterations.

In our first results, the best performing network was a simple single-layer neural network with just five hidden nodes. Plotting it, we can easily see its structure (click any image to view the full-resolution version):

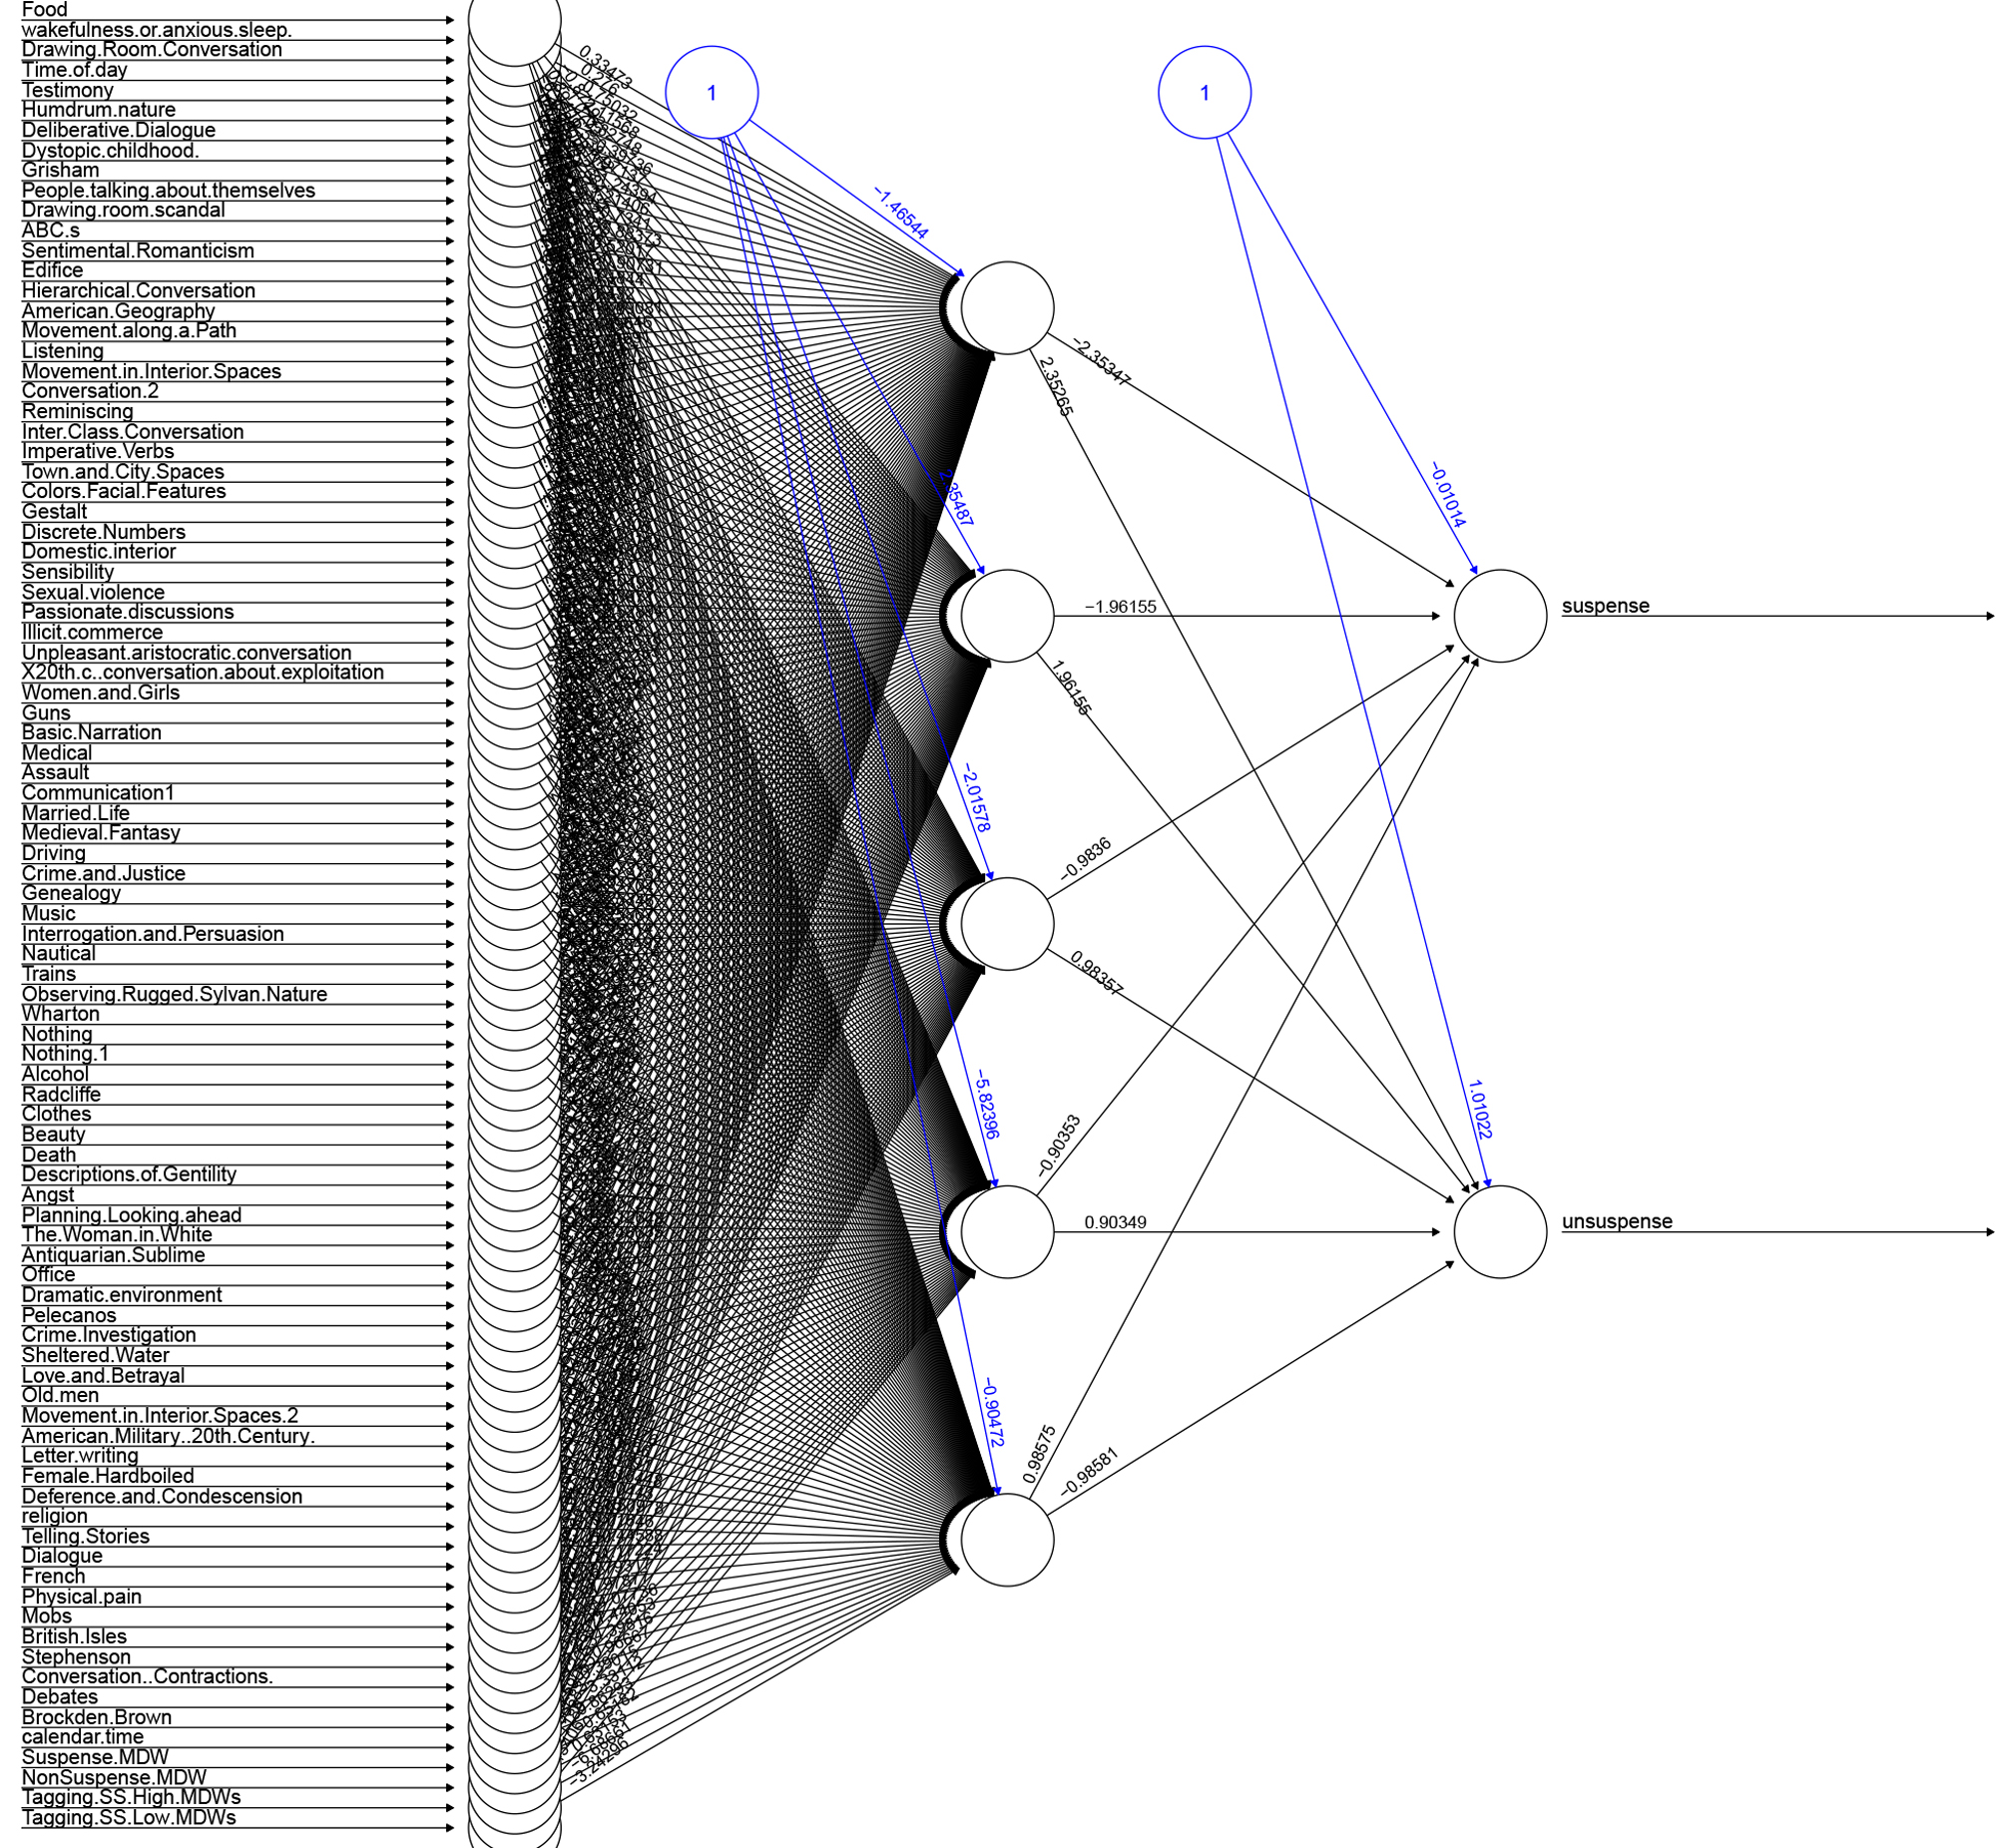
Not only did this success rate outperform logistic regression (65% correct) and SVM (62% correct), but its accuracy overall astonished us. We had expected to observe and draw conclusions from its failures, but here, the successes are far more informative. Based solely on a set of semantic fields, culled from topics models and distinctive words, our virtual reader was able to correctly predict a human rater’s response to a passage four out of five times.

Although one the limitations on using a neural network is our inability to reconstruct the logic behind the weights it assigns to individual nodes (and thus the exact mechanism of its classification decisions), it is still possible to peek into the black box and see the relative magnitude of importance of each variable (if not its precise relationship to the other features or the direction of its weight). And, by bringing our critical understanding of the data to the weights, we can begin to productively unpack the classifier. For the model above, we were able to use a garson plot from the package NeuralNetTools to see the relative importance of each feature in deciding whether a passage was suspenseful or unsuspenseful:

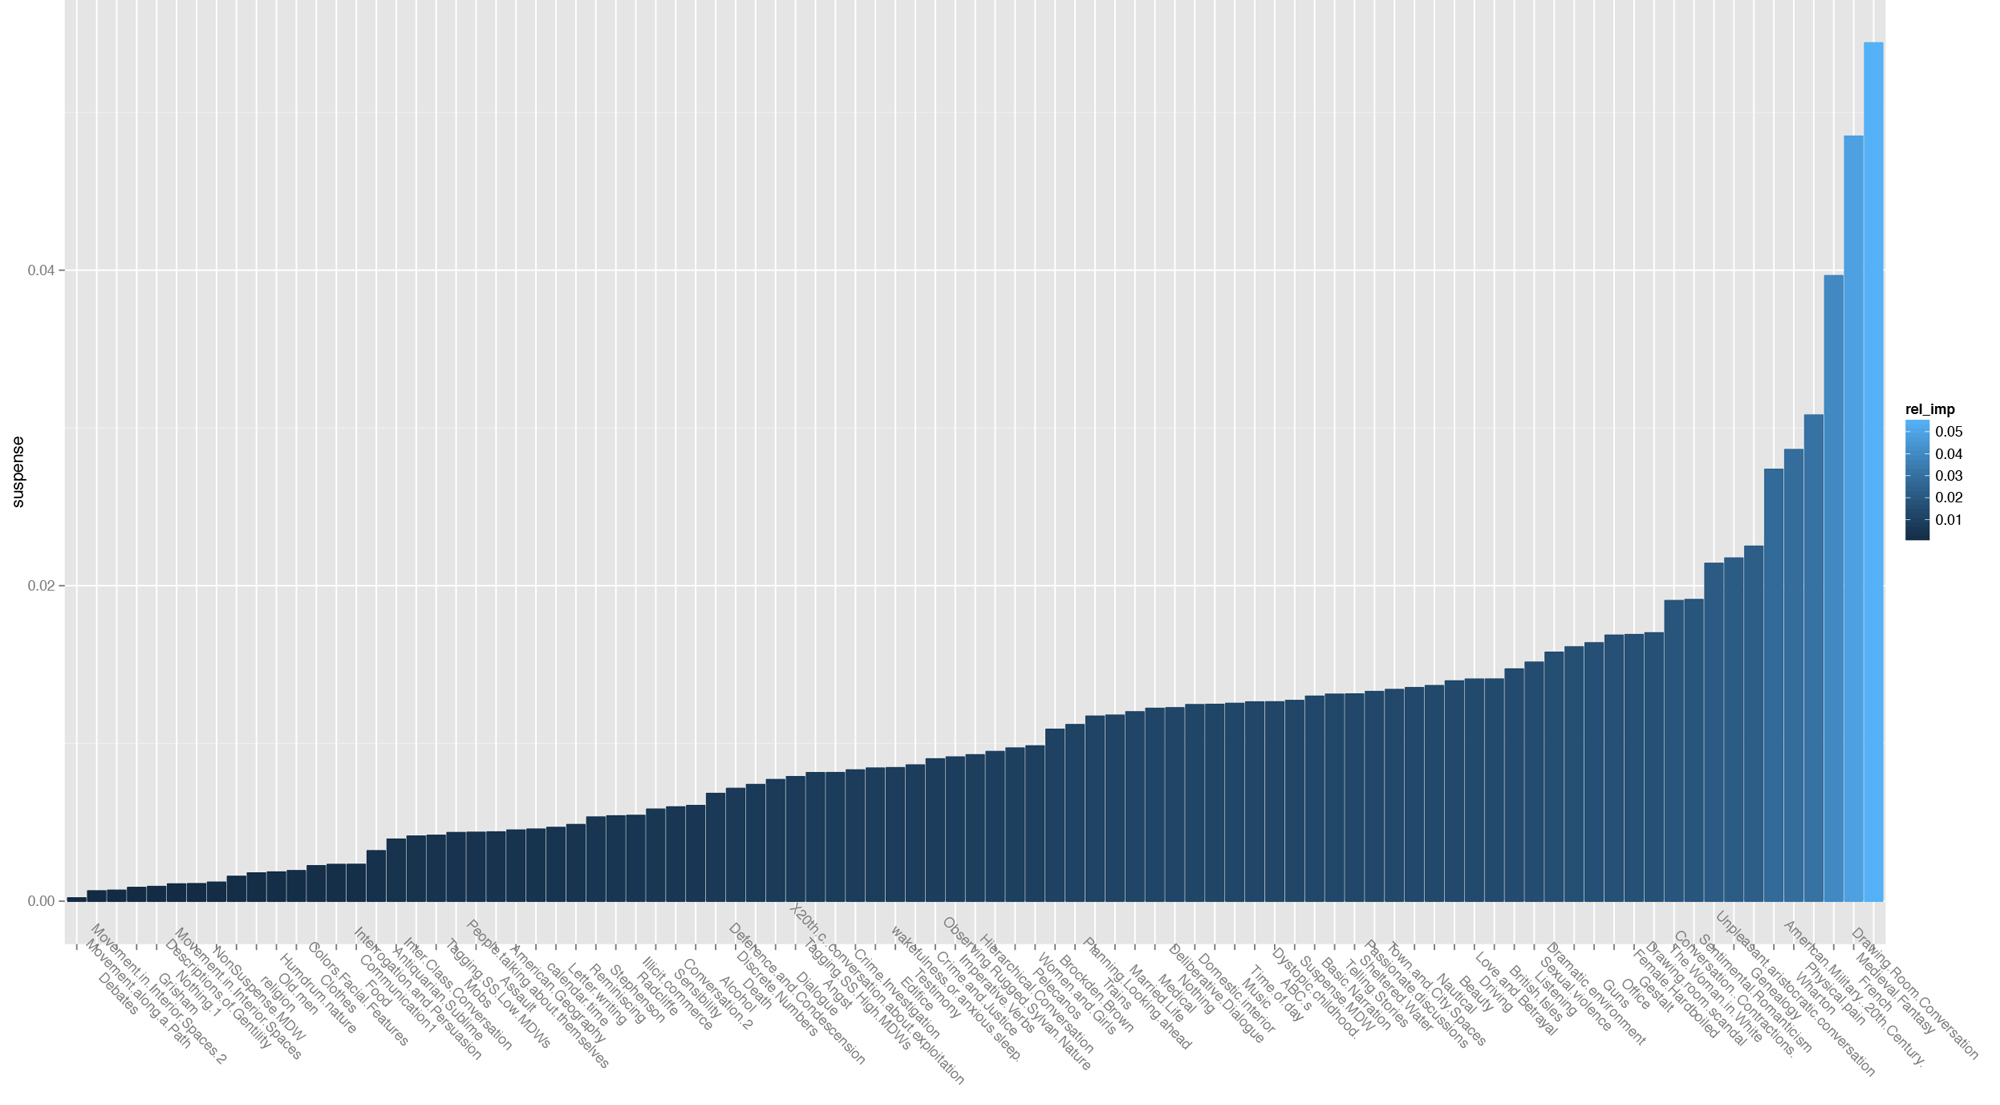
From the neural network then, we were able to not only ascertain that there is a predictive relationship between at least some of the formal features that we identified, and whether the passage was suspenseful or unsuspenseful, but also what features were most strongly associated with suspenseful topics (either in their presence, as we suspect for the topics that we termed “Physical Pain” and “American Military”, or in their absence, as we suspect for “Drawing Room Conversation” or “Sentimental Romanticism”).

The neural network, then, became a virtual participant in the project, an overlay of all of the individual reading experiences of all of the human participants. But it was a participant that was also able to associate patterns of topic and distinctive and difficult word usage with suspenseful or unsuspenseful passages across all of our texts regardless of period or genre. By reading this composite reader, whose level of detail is unmatched by any of our human participants, we were finally able to start drawing the conclusions about the relationship between semantics and suspense that had eluded us during the initial stages of the project. Our unexpected turn from exploratory clusters to supervised classification, from a digitally assisted hermeneutics, to a radically altered meta-observational method, finally provided some answers to many of our initial questions about suspense as a formal property, even as it began to make these questions obsolete by pushing us in new, unlooked for, directions. In this, then, lies both the limits and the promise, the frustration and the excitement, of our work at the Lab.

[1] This, for example is what Stephen Ramsay calls “algorithmic criticism” in his book Reading Machines, when he describes how computational methods “deform” the texts.

[2] Ted Underwood’s recent work using the success and failure of logistic regression to identify genre consistency and identity over time is an excellent example of this process in action.

[3] In ‘measuring’ the features in passages, we abandoned the posterior probabilities of the topic model, or the p-values of the distinctive words and instead calculated the percentages of words in each passage that came from each field, normalizing the results by the expected value of that field in the overall corpus.

[4] So, for example, the vector (9,9,5,5) would describe a network with four hidden levels and nine hidden nodes in each of the first two levels and five nodes in the final two levels.

  •  

Humanities Without Humanists

The humanities are used to feeling embattled, and, consequently, to making excuses for their existence. We should be allowed to study literature, one such line of argument goes, because reading and writing make students better employees or better citizens or more empathic human beings --- because literature has some merit that is not merely aesthetic. Take, for instance, a widely publicized article in Science affirming that "Reading Literary Fiction Improves Theory of Mind": the psychologist authors, while acknowledging the "difficulty in precisely quantifying literariness," casually reify that "literariness" in their effort to demonstrate its virtues, concluding that reading "prize-winning" texts seems more beneficial, psychologically healthier, than reading "popular" fiction. The fact that literary scholars would be likely to reject the precise terms of their distinction --- which places Dashiell Hammett and Robert Heinlein in the same category as Danielle Steel and Christian novelist William Paul Young, and which ignores variables like translation, publication date, and author demographics --- was trumped, when the article was picked up in the popular media, by the suggestion that we should be grateful that these scientists have taken an interest in our object of study.

In a sense, I am. Among literary study's dizzying series of 21st-century "turns," the empirical one strikes me as the most intellectually stimulating and the likeliest to last, providing a means for literary scholars to generate and test falsifiable hypotheses without abandoning the interpretive rigor that characterizes our discipline. And digital humanities, of course, is the star of this new empiricism; the question is --- why? What is it about large-scale quantitative analysis that strikes us as so invigorating and so promising? This question may sound like a softball, but I think a prolonged discussion would reveal that many of us in DH actually disagree on the answer. I have one, of course, that I think is right --- but before I get to it, I want to explore one especially common wrong answer.

A few weeks ago, an article started showing up in my Twitter feed and my email inbox. The title was admirably straightforward --- "The emotional arcs of stories are dominated by six basic shapes" --- and the authors were all mathematicians or computer scientists, mostly based in the Computational Story Lab at the University of Vermont. Having generated "emotional arcs" by assigning sentiment scores within a 10000-word sliding window (using a tool delightfully named the Hedometer), the team then classified the arcs into six major "modes" using Singular Value Distribution. Because the team was able to duplicate these "modes" as clusters via both hierarchical clustering and unsupervised machine learning, and because randomly shuffled "word salad" versions of the texts did not generate similar arcs, the authors feel justified in their conclusion that "these specific arcs are uniquely compelling as stories written by and for homo narrativus."

Well --- ok. This is extraordinarily similar to Matt Jockers's Syuzhet project (right down to the identification of 6-7 basic plot types), which the authors never mention by name in the body of the article; but perhaps the conventions of citation are sufficiently different for computer scientists that this does not read to them as unethical.[1] It's a huge and essentializing claim, which makes many humanities scholars uneasy; but what is DH for if not to push us toward more ambitious arguments? There may be issues with generalizing about all stories from what is at best a corpus limited by time and nationality (Gutenberg, for which I have a deep and abiding love, is nonetheless very Eurocentric); but it's still better, surely, to put forward a suggestion that future research can refine than to make the kind of contentless claim --- "both affirms and subverts," "both endorses and undermines" --- we used to see in the bad old days of anti-empiricist criticism, the kind of claim that aims for nuance but flounders in vagueness. Right?

Right, I think, in principle. But then one looks at the authors' lists of the top 5 texts associated with the various arcs, and notices something curious.[2] Here's A Christmas Carol, sure, and A Hero of Our Time; here's The Adventures of Tom Sawyer and something called Tarzan the Terrible; here's --- Fundamental Principles of the Metaphysic of Morals. Kant? A one-off mistake, perhaps? But wait, it's Notes on Nursing by Florence Nightingale, and Lucretius's On the Nature of ThingsThe Economic Consequences of the Peace and Cookery and Dining in Imperial Rome, which is quite literally a book of recipes --- and all these, mind you, drawn from the top five most representative examples of each story arc (although one finds plenty more nonfictional works when one examines the hierarchical tree in the appendix). Kant, for instance, is apparently the fifth most perfect instance of the "Man in a Hole" narrative template (a designation the authors borrowed from Kurt Vonnegut) --- possibly by way of Jockers again, who cites the same Vonnegut talk); this has a certain hilarious aptness, but is ultimately hard to fathom.

A significant subset of the "stories" analyzed by the authors, then, appear not even to have been narratives, let alone fictional ones. But there's a more subtle problem with some of the fictional works as well. One might see the name of Balzac or Poe and assume that we are here at least dealing with appropriate narrative texts. But one of those Balzac "narratives" is The Human Comedy: Introductions and Appendix, while Poe's collected Works make an appearance; there are also anthologies of works that aren't even by a single author, like Fifty Famous Stories Retold or Humour, Wit, and Satire of the Seventeenth Century. (The authors identify A Primary Reader as "among the most categorical tragedies [they] found," which would surely alarm the well-intentioned elementary school teacher who composed this story collection for her first-grade charges.) If you try to track an "emotional arc" across one of these anthologies, you may well get a pattern that seems recognizable, but it will be invalidated by the presence of discrete narratives within the text: "The Murders in the Rue Morgue" and "The Balloon-Hoax," for instance, have distinct and unrelated arcs, but would show up by the authors' methods as mere moments in a larger "narrative" that does not, in fact, exist --- not in authorial intention, and not in readerly experience.

Here you may object, reasonably, that I'm piling on, dismantling an analysis that isn't necessarily worth the trouble; after all, digital humanists know that we're supposed to clean up our corpora and retain metadata on texts' genres, whereas the authors of this paper seem not to have recognized that these steps were important. And it's true, they surely didn't realize; but this is exactly my point. For researchers with any sort of background in literary studies, the results obtained here would have provided valuable feedback about the accuracy of the "Hedometer" tool: if your sentiment analysis algorithm is finding emotional arcs in Kant and cookbooks, it is effectively broken.[3] Precisely because the authors didn't begin by conceptualizing fiction and non-fiction, or narrative and non-narrative, as discrete categories within "the literary," the discovery that the two showed the same characteristics under "Hedometer" did not register as problematic or even surprising --- as, objectively, it should be.

The same goes for countless other morsels of expert knowledge that would, in a successful DH project, provide a sanity check on the plot arc results. Does the sentiment analysis tool adequately deal with irony --- and, if not, can we assume that this washes out in a large data set, or do we need to exercise special care with particular authors or genres? Might focalization choices have predictable effects on textual sentiment that would add more nuance to the Hedometer's judgments? How do these story templates, if they prove accurate, interact with more prescriptive theories of plot structure (for instance, the Aristotelian model that the authors mention in their introduction)? These are not follow-up questions, building on the data generated by this research project; they are integral to determining that data's validity and meaning. If the authors so thoroughly miss an opportunity to say something worthwhile about the humanities, it is because they ignore the concepts and tacit knowledge internal to literary study; rather than operationalizing literary concepts --- character, canonicity, personification, poetic meter --- with the help of big(gish) data, these "emotional arcs" are built on shaky conceptual foundations, making even the basic information they purport to provide practically unusable.

I've been focusing my criticism on the applied mathematicians who wrote this paper, which may seem to suggest that I believe we humanists would never do this; we'd never let our love for an analytical tool blind us to the weak results it produced, or elide humanistic knowledge in the interest of arresting visualizations. It might be more accurate, though, to say that when we do this, it can't necessarily be explained by mere ignorance. Rather, DH projects that treat the humanities as a mere data set --- rather than a robust mode of inquiry with protocols of its own --- are making a calculated decision to use science as a legitimizing tool rather than a truly investigative one. The implication, I think, is that your average non-digital humanist is simply a subpar scientist, and that one can therefore learn more by applying quantitative tools to raw texts than by generating hypotheses and writing programs on the basis of humanistic knowledge. Contrary to many non-DH practitioners who seem to think that this devaluation is DH's ultimate agenda, I'd argue that nothing could be more fatal to the future of the digital humanities. What a truly empirical humanities would suggest, after all, is that literature (for instance) is worth investigating for its own sake, beyond the potential for monetizing a particular plot structure or trading on cultural capital; as a complex form of human behavior, literature deserves the same conceptual rigor and expertise that we would have no qualms about bringing to, say, the study of traffic planning or coral colonies. (Would a mathematician consider analyzing coral reef distribution without consulting a marine biologist, or indeed even reading any active marine biologists?) To allow papers like this one to represent DH --- as, flattered and hopeful, we often do --- is to mistake undisciplinary for interdisciplinary research, or indeed to forget that we have a discipline at all. It's short-term visibility, bought with long-term extinction.

[1] The authors critique Jockers’s project, linking to his work in a footnote without explicitly mentioning him, when they claim that “other work” on sentiment analysis within texts has confused “the emotional arc and the plot of a story.” Given that the authors label their own emotional arcs with plot-type designations like “Rags-to-riches,” “Cinderella,” “Tragedy,” and “Icarus,” one might suspect that they themselves are not entirely scrupulous about this distinction. Ben Schmidt, in his blog post responding to the paper, also notes the similarity to Jockers’s work.

[2] Again, Schmidt noticed this too, in a blog post I became aware of after writing this one. He points out, correctly, that the authors’ means of separating fiction from non-fiction — length and download count — are “*terrible* inputs into a fiction/nonfiction classifier.”

[3] As David McClure pointed out to me in conversation, there is another explanation for this phenomenon: it could be that these non-narrative texts do in fact have emotional arcs that the tool is picking up accurately, and that the authors have discovered something about the affective structure of nonfiction. This is certainly possible, but I think one could only make the argument if the authors had derived their six “emotional arcs” from a corpus that they knew to contain only narratives; in that case, finding evidence of narrative structures in a non-narrative text would suggest that the text did in fact have some narrative component. Because the non-narratives were baked into the corpus from the beginning, though, their arcs presumably influenced the outcome of the SVD analysis, making it hard to argue that these arcs reflect anything distinctive about stories per se.

  •  

Counting words in HathiTrust with Python and MPI

In recent months we've been working on a couple of projects here in the Lab that are making use of the Extracted Features data set from HathiTrust. This is a fantastic resource, and I owe a huge debt of gratitude to everyone at HTRC for putting it together and maintaining it. The extracted features are essentially a set of very granular word counts, broken out for each physical page in the corpus and by part-of-speech tags assigned by the OpenNLP parser. For example, we can say -- on the first page of Moby Dick, "Call" appears 1 time as a NNP, "me" 5 times as a PRP, and "Ishmael" 1 time as a NNP, etc. What's missing, of course, is the syntagmatic axis, the actual sequence of words -- "Call me Ishmael." This means that it's not possible to do any kind of analysis at the level of the sentence or phrase. For instance, we couldn't train a word2vec model on the features, since word2vec hooks onto a fairly tight "context window" when learning vectors, generally no more than 5-10 words. But, with just the per-page token counts, it is possible to do a really wide range of interesting things -- tracking large-scale changes in word usage over time, looking at how cohorts of words do or don't hang together at different points in history, etc. It's an interesting constraint -- the macro (or at least meso) scale is more strictly enforced, since it's harder to dip back down into a chunk of text that can actually be read, in the regular sense of the idea.

The real draw of this kind of data set, though, is the sheer size of the thing, which is considerable -- 4.8 million volumes, 1.8 billion pages, and many hundreds of billions of words, packed into 1.2 terabytes of compressed JSON files. These numbers are dizzying. I always try to imagine what 5 million books would look like in real life -- how many floors of the stacks over in Green Library, here at Stanford? How many pounds of paper, gallons of ink? In the context of literary studies, data at this scale is fascinating and difficult. When we make an argument based on an analysis of something like Hathi -- what's the proper way to frame it? What's the epistemological status of a truth claim based on 5 million volumes, as opposed to 2 million, 1 million, a hundred thousand, or ten? Surely there's a difference -- but how big of a difference, and what type of difference? Is it categorical or continuous? What's the right balance between intellectually capitalizing on the scale of the data -- using it to make claims that are more ambitious than would be possible with smaller corpora -- and also avoiding the risk of over-generalizing, of mistaking a (large) sample for the population?

These are wonderful problems to have, of course. In addition to the philosophical challenges, though, we quickly realized that the size of the corpus also poses some really interesting technical difficulties. The type of code that I'm used to writing for smaller corpora will often bounce right off a terabyte of data -- or at least, it might take many days or weeks to inch through it all. To help kick off the lab's new Techne series, I wanted to take a look at some of the parallel programming patterns we've been working with that make it possible to spread out these kinds of big computations across many hundreds or thousands of individual processors -- namely, a protocol called the "Message Passing Interface" (MPI), a set of programming semantics for distributing programs in large computing grids. This is under-documented, and can feel sort of byzantine at times. But it's also incredibly powerful, and, from a standpoint of programming craft, it introduced me to a whole new way of structuring programs that I had never encountered before.

Now, I'd be remiss not to mention that HathiTrust actually provides a platform that makes it possible to run custom jobs on their computing infrastructure. (You can sign up for an account here.) This is extremely cool, though we've run into a number of situations recently -- both with Hathi and with other data sets -- where we found ourselves needing to write this type of code, so I wanted to figure out how to do it in-house. The extracted features seemed like an obvious place to start.

The simple way -- loop through everything, one-by-one

So, we've got 5 million bzipped JSON files. Generally, to pull something of interest out of the corpus, we need to do three things -- decompress each file, do some kind of analysis on the JSON for the volume, and then merge the result into an aggregate data structure that gets flushed to disk at the end of the process.

Say we've got a Python class that wraps around an individual volume file in the corpus:

This just reads the file, parses the JSON, and sets the data on the instance. Here, we've got a token_count() method, which steps through each page and adds up the total number of tokens in the book.

And, similarly, say we've got a Manifest class, which wraps around a local copy of the pd-basic-file-listing.txt from Hathi, which provides an index of the relative locations of each volume file inside the pairtree directory. Manifest just joins the relative paths onto the location of the local copy of the features directory, and provides a paths attribute with absolute paths to all 5M volumes:

To run code on the entire corpus, the simplest thing is just to loop through the paths one-by-one, make a volume instance, and then do some kind of work on it. For example, to count up the total number of tokens in all of the volumes:

This kind of approach is often good enough. Even if it takes a couple hours on a larger set of texts, it often makes more sense to keep things simple instead of putting in the effort to speed things up, which itself takes time and tends to make code more complex. With Hathi, though, the slowness is a deal-breaker. If I point this at the complete corpus and let it run for an hour, it steps through 14,298 volumes, which is just 0.2% of the complete set of 4.8 million, meaning it would take 335 hours -- just shy of 14 days -- just to loop through the pages and add up the pre-computed token counts, let alone do any kind of expensive computation.

Why so slow? Reading out the raw contents of the files is fast enough, but, once the data is in memory, there's a cost associated with decompressing the .bz2 format and then parsing the raw JSON string, which, for an entire book's worth of pages, is long. But, since neither of these steps are IO-bound -- the costly work is being done by the CPU, not the disk -- this is ripe for parallelization. Out of the gate, though, Python isn't great for parallel programming. Unlike some more recent languages like Go, for example -- which bakes concurrency primitives right into the core syntax of the language -- Python programs always run on a single CPU core, and the much-maligned "global interpreter lock" means that only a single thread is allowed to do work at any given moment, regardless of the resources available on the machine.

The better way -- multiple cores on the same machine

To work around this limitation, though, Python has a nice module called multiprocessing that makes it easy to make use of multiple cores -- the program is duplicated into separate memory spaces on different CPUs, work is spread out across the copies, and then the results are gathered up by a controller process at the end. The API is fairly large, but it's generally easiest to use the Pool class, which basically provides parallel implementations of map in a couple of different flavors. For example, with the Hathi data -- we can write a worker function that takes a file path and returns a token count, and then use the imap_unordered function to map this across the list of paths from the manifest:

This produces a really nice speedup -- now, over an hour, a 16-core node steps through 117,951 volumes, an 8x speedup from the single-process code. But, the numbers are still forbidding when scaled up to the full set of 5M volumes -- even at ~120k volumes an hour, it would still take about 40 hours to walk through the corpus. And again, this is just the bare minimum of adding up the total token count -- a more expensive task could run many times slower.

Can we just keep cranking up the number of processes? In theory, yes, but once we go past the number of physical CPU cores on the machine, the returns diminish fairly quickly, and beyond a certain point the performance will actually drop, as the CPU cores start scrambling to juggle all of the processes. One solution is to find a massive computer with lots of CPUs -- Amazon Web Services, for example, now offers a gigantic "X1 32xlarge" instance with 128 cores. But this is pretty much the upper limit.

MPI -- multiple cores on multiple machines

So, only so many cores can be stuffed into a single machine -- but there isn't really a limit to the number of computers that can be stacked up next to each other on a server rack. How to write code that can spread out work across multiple computers, instead of just multiple cores?

There are few different approaches to this, each making somewhat different assumptions. On the one hand there are "MapReduce" frameworks like Hadoop and Spark, which grew up around the types of large, commodity clusters that can be rented out from services like Amazon Web Services or Google's Compute Engine. In this context, the inventory is often enormous -- there are lots and lots of servers -- but it's assumed that they're connected by a network that's relatively slow and unreliable. This leads to a big focus on fault tolerance -- if a node goes offline, the job can shuffle around resources and recover. And, since it's slow to move data over a slow network, Hadoop is really invested in the notion of "data locality," the idea that each node should always try to work on a subset of the data that's stored physically nearby in the cluster -- in RAM, on an attached disk, on another machine on the same server rack, etc.

Meanwhile, there's an older approach to the problem called the "Message Passing Interface" (MPI), which is used widely in scientific and academic contexts. MPI is optimized for more traditional HPC architectures -- grids of computers wired up over networks that are fast and reliable, where data can be transferred quickly and the risk of a node going offline is smaller. MPI is also more agnostic about programming patterns than MapReduce frameworks, where it's sometimes necessary to formulate a problem in a fairly specific way to make it fit with the map-reduce model. MPI is lower-level, really just a set of primitives for exchanging data between machines.

From the perspective of the programmer, MPI flattens out the distinction between different cores and different computers. Programs get run on a set of nodes in a computing cluster, and, depending on the resources available on the nodes, the program is allocated a certain number of "ranks," which are essentially parallel copies of the program that can pass data back and forth. Generally, one rank gets mapped onto each available CPU core on each node. So, if a job runs on 32 nodes, each with 16 cores, the program would get replicated across 512 MPI ranks.

Writing code for MPI was a bit confusing for me at first because, unlike something like a multiprocessing Pool, which is functional at heart -- write a function, which gets mapped across a collection of data -- with MPI the distinction between code that does work and code that orchestrates work is accomplished with in-line conditionals that check to see which rank the program is running on. You just write a single program that runs everywhere, and that program has to figure out for itself at runtime which role it's been assigned to. MPI provides two basic pieces of information that makes this possible -- the size, the total number of available ranks, and the rank, a offset between 0 and size that identifies this particular copy of the program. To take a trivial example -- say we've got 5 MPI ranks, and we want to write a program to compute the square root of 4 numbers. Rank 0 -- the controller rank -- broadcasts out each of the numbers, and then ranks 1, 2, 3, and 4 each receive a number and do the computation:

Beyond this kind of simple “point to point” communication – one ranks sends some data, another receives it – MPI also has a number of synchronization utilities that make it easier to coordinate work across groups of ranks. Unlike the code above, most MPI programs have just two branches – one for rank 0, which is responsible for splitting up the task into smaller pieces of work, and another for all of the other ranks, each of which uses the same code to pull instructions from rank 0. For example, the scatter and gather utilities make it possible to split a set of input data into N pieces, “scatter” each piece out to N ranks, wait until all of the worker ranks finish their computations, and then “gather” the results back into the controller rank. Eg, for the square roots:

This is starting to look like the kind of approach we’d want for a data set like Hathi – just replace the integers with volume paths, and the square roots with some kind of analysis on the feature data. In essence, something like:

This works like a charm. Here’s a complete program that counts up the total number of tokens in the corpus:

(Simplified just a bit for readability -- see the full version here, along with the benchmarking programs for all the other code in this post.)

On 16 nodes on Stanford's Sherlock cluster, this runs in about 140 minutes -- ~2.3 hours -- a 18x speedup over the multiprocessing solution on a 16-core machine and 145 times faster than the original single-threaded code. And, this scales roughly linearly with the number of nodes -- 32 nodes would finish in just over an hour, 64 in half an hour, etc. This approach has served us well with the first projects we've been using the Hathi data for -- a look at the history of the word "literature," in collaboration with a group at Paris-Sorbonne. Though, I'm still new to this type of programming, and my guess is that there are ways that this could be improved pretty significantly.

One question I'm still unsure about -- instead of decompressing the volumes on-the-fly during jobs, would it make sense to just do this once, write the inflated files back to the disk, and then run jobs against the regular JSON? I think this would speed up the jobs themselves -- the decompression step accounts for about 40% of the time that it takes to materialize a volume. (Though, we'd also be pulling more data off the filesystem, which takes time -- so I'm not sure.) I haven't gone down this road, though, because it seems like there are other costs, if only in terms of data management and programming hassle. It would take up much more disk space, for one thing -- about 9 terabytes, on top of the 1.2 for the original files. And, it would mean that we'd have to remember to re-run this step if Hathi updates the corpus, etc. As a rule of thumb -- I never really love the idea of creating "downstream" versions of data sets when it can be avoided, since I think it often adds surface area for mistakes and makes things harder to reproduce down the line. If the MPI-ified job can run in 2 hours against the original .bz2's, I'm not sure it would be worth adding complexity to the code just to get it down to 1 hour, or whatever. I guess this might make sense if we were running lots and lots of jobs, but I doubt we'll be doing that.

So, how many tokens in Hathi? We count 814,317,177,732 -- which, I have to pinch myself to remember, is 80% of a trillion. This is actually quite a bit more than the 734 billion number reported by Hathi back in 2015. Maybe it's grown a billion-odd words in the last year? Or, we might be counting differently -- we're just adding up the top-level tokenCount keys on each page, which I believe include all the OCR errors that would get filtered out in real projects.

Either way -- Hathi is a kind of Borgesian dream. More to come.

  •  

Working in the Lab, Part 1

On my first day of work, I looked up the term "operationalize" in the dictionary. A mixture of curiosity and sheer pragmatism led me to do this; after all, the project I was about to embark on aimed to "operationalize time." More specifically, the ultimate goal was to create a computer program that might track the progression of time in fiction (that is, in novels and short stories). I thought it wise to have at least some sense of what this actually entailed. To my utter dismay, however, what I found online was not of much help. According to Merriam-Webster, the transitive verb means "to make operational." (Boy, was that instructive!) I did learn a fun, random fact, though: in terms of popularity, "operationalize" is in the bottom 30% of searched words. Filled with both frustration and excitement, I decided to heed my project leader's advice and read a Literary Lab pamphlet written by English professor (and Lit Lab founder), Franco Moretti. His fifteen-page paper, titled "'Operationalizing': or, the function of measurement in modern literary theory," clarified my doubts tremendously. (Also, an important lesson was learned: always follow older and smarter people's advice.) Here is the general gist:

"Operationalizing means building a bridge from concepts to measurement, and then to the world. In our case: from the concepts of literary theory, through some form of quantification, to literary texts." (Moretti, 1)

"Taking a concept, and transforming it into a series of operations." (Moretti, 2)

Armed with a better understanding of "operationalize," I was ready to start tagging my first work of fiction. I read Ernest Hemingway's "The Killers." This is an excellent story, but before I dive into the process of tracing its advancement of time, allow me to restate, in more detailed terms, the look and feel of my research. The process is fairly straightforward: choose a novel or short story. Break it up into discrete scenes (e.g. a conversation between two characters would be separate from the description of a house). It helps to imagine what a film adaptation of the given fictional piece might look like---that is, what set of actions would constitute a single shot or a related series of them. Lastly, ascribe a time duration to every single scene, in units of minutes. Alright, now back to Hemingway. I am extremely glad his story was the first one I got to tag; the experience proved to be quite enjoyable. The narrative was linear, meaning there were no unexpected flashbacks or flash-forwards to consider. In other words, I could easily partition the tale into standalone scenes. In order to figure out the durations, I read aloud the dialogue between the characters and timed myself with my cellphone's chronometer. Unfortunately, the next stories I read---William Faulkner's "A Rose for Emily" and Henry James's "Jolly Corner"---were not as simple to tag. In the case of Faulkner, the difficulty came from the fact that most paragraphs were expository; they read as descriptions (of settings, for instance, or characters' backstories) as opposed to plot advancements. Would a paragraph indicating the look of a living room account for any time in a movie? Probably not, since the living room could just be shown instantly, in a shot. The reason James's story was tricky was the abundance of Spencer Brydon's thoughts. After all, how long does a thought (or a chain of thoughts) last? More often than not, I went with my gut when tagging these works of fiction. I read Arthur Conan Doyle's The Hound of the Baskervilles and Toni Morrison's The Bluest Eye. For both of these novels, the breakup of scenes part was easy, while the assignment of time durations was not. Still, I am glad I took part in the experiment. As Erik Fredner pointed out to me: "not only is precision impossible in this context since texts are imprecise in their timing," but "precision isn't even the goal."

Ena Alvarado is a Stanford junior from Caracas, Venezuela studying English. She may love reading and writing a little too much.

  •  

Working in the Lab, Part 2

I first became familiar with the Literary Lab when I took a class on literary text mining in R with Mark Algee-Hewitt last winter. From discussing the philosophies behind the digital humanities to constructing cluster dendrograms (plus lots of other cool graphs) of Poe's short stories, I loved the class and was excited to start working at the lab!

The first project I contributed to was the Identity project, which investigates the discourse on race in American literary texts from the late 18th century until the mid-20th century. Much of my time was devoted to reading novels and replacing references to black characters' names with fixed tags. I personally read and tagged The Sound and the FuryTheir Eyes Were Watching GodOur NigThe Adventures of Huckleberry FinnThe Conjure WomanWestward Ho!Three Lives, and Uncle Remus: His Songs and Sayings. These character-tagged texts would later be used in a collocate analysis.

The tagging seemed simple enough, but I soon ran into problems with pronouns. Should a pronoun reference have the same tag as a named reference? And moreover, should we distinguish between reflexive and personal pronoun tags? Using a single, fixed tag could streamline future analyses, but using multiple tags could lead to potentially more revelatory results. After conferring with the principal researchers, we decided to alter tags based on the type of pronoun. As I was reading through the texts, I noticed that sentences containing reflexive pronouns sometimes revealed how characters conceived of their own identities, often as they related to race. The collocate analysis done by the principal researchers produced some surprising results---for example, a common word found in collocates of reflexive pronouns was "value".

From another project, I learned first-hand that projects often run into obstacles early on, and that's valuable---it can help clarify goals and shed light on new ways of doing. About a month before I started at the lab I'd been thinking a lot about nebulous genre words such as "postmodern". I thought about doing an empirical content analysis of texts generally considered postmodern to see what their defining characteristics are according to a computer. I ran into a challenge right away---how could I construct a corpus that was free of bias? The other members of the lab and I came up with a set of 50 novels we considered postmodern, and I then verified the accuracy of the label by finding peer-reviewed articles describing the novels as postmodern. Yet all the same we were still coming up with a set of novels ourselves to fit within a corpus of arbitrary size. We did, however, decide to make a control corpus which will consist of a random set of novels from the lab's 20th century corpus with the same date distributions as those in the postmodern corpus. The randomness inherent in that corpus could control for bias better.

I planned to work in R and use topic models and keywords in context. At the start, I ran a trial topic model on a subset of the corpus and found it a little hard to make sense of (if only it would clearly assign names to topics!). And I soon realized that my goals were constrained by the tools I was using. Topic models and keywords in context are useful for understanding thematic postmodernism---that is, the specific words and topics that make up postmodern texts. Yet postmodern novels often experiment with form, from employing extensive commentaries such as in Pale Fire to extensive footnotes such as in Infinite Jest. A text file of Infinite Jest in which the footnotes blend together with the actual text could give us distorted results about the most prominent words in the novel, yet it's hard to dispute that the footnotes are essential to the experience of reading the novel. For making sense of stylistically postmodern characteristics---things often rendered best in print form---my best bet was reading the texts themselves or having knowledge of the form beforehand. After all, there's no one way of being experimental in form, and such experimentation is not necessarily easy for a computer to recognize.

Going forward, I'm thinking of trying out more methods in R such as clustering or most distinctive words. I'm also considering revamping my corpus to only include novels with the highest number of "postmodern" affirmations in peer-reviewed articles; I suspect this could alleviate bias in the corpus. And I'll read up more on postmodern literature and theory so that I can better interpret the results in R as they compare to widely-held views. Digital tools can help maneuver wide-ranging literary questions, but it's really a solid knowledge of literature that makes all the data visualizations and topic models the most meaningful. I'll continue to learn!

Sarah Thomas is a sophomore at Stanford majoring in English. In her spare time she hosts a radio show called Life Aquatic on KZSU.

  •  

Working in the Lab, Part 3

This was my sophomore summer with the Literary Lab. I started the summer ready to capitalize on my veteran knowledge and pick up where I left off. I did just that when I spent the the first weeks of summer working on what we in-house called the Identity Project, but what is officially known as "Representations of Race and Ethnicity in American Fiction, 1789-1964". My fellow RAs from last year and I were part of the project's nascent stages. We helped gather the 193 texts for the project's handpicked corpus (this process included more OCR-ing than I'd ever like to do again). But, the idea for the project was fascinating and I was excited to see how it would develop. Some of my primary academic interests are investigating race in the context of American society, media and history. When I returned this summer, the project had developed significantly. We had already garnered --- no exaggeration --- hundreds of thousands of collocates for our twelve ethnic groups. The next phase of the project, which I was primarily involved with, focused on examining how the discourse about characters who embodied our ethnic groups may or may not have differed from the general discourse surrounding these groups. My task was to read novels and tag certain black characters for collocate analysis. I personally read Uncle Tom's Cabin and Native Son.

While my task was at times painstakingly repetitive (replacing ambiguous pronouns for specific characters with a unique ID can only be so riveting), I was excited to see the results of my work and engage in the analytical process. I sat in on my first results meeting at the lab and got a peek behind the curtain to see more of what goes into producing high level scholarly work. It was fascinating to sit in and listen to the kind of discussions that came about, like why "minstrel" was a specific collocate for "ethiopian" or how the Eastern European target group collocates consisted primarily of orchestral-related and political terms. It was also reassuring to see how the principal investigators were just as overwhelmed with the scale of results we produced as I was. The data from this project is fertile enough to produce years and years of scholarly work. Ultimately, that's what I'll take pride in the most: weeks of my effort helped to create this incredible set of information that can be a starting point for so much diverse and intriguing academic inquiry.

It's actually kind of funny; when I initially applied to work at CESTA [the Center for Spatial and Textual Analysis], I applied for a specific spatial history project, but I instead found my way to the Literary Lab. I had some reservations; I was worried about being the only non-English major, woefully under-qualified to work at a literary focused group. But, with this project and my overall experience with the Lit Lab, I've really learned that humanistic inquiry, in all its forms, is something that I have found and will always find captivating. I look forward to where the Lab takes me next!

Asha Isaacs is a junior in the psychology department at Stanford, and is fascinated by all forms of humanistic inquiry.

  •  

How many novels have been published in English? (An Attempt)

Not for the first time, I find myself wanting to know how big the field of the novel is. Granted, finding the precise number of novels published in English is impossible. And even if we had an exact figure, the number of published novels doesn't directly address the question of the genre's cultural extent since it wouldn't account for self-publishing, personal writing shared among friends, fan fiction, etc. Nevertheless, having an approximate answer to this question seems useful for two reasons: First, I genuinely didn't know at what order of magnitude the field of the novel operates. Is the number of novels in the tens or hundreds of millions? Or is it shockingly modest---maybe just a few hundred thousand? Second, this question is worth asking because the order of magnitude matters. We know that we only study a tiny portion of the novel field, and that what we do study is deliberately nonrepresentative. Knowing the scope of our reading in comparison to the field as a whole gives us a better sense of how circumscribed our claims about "the novel" are. Asking about the "representativeness" of our samples connotes a quantitative humility.

So, an attempt: According to Bowker's Books in Print, there were 2,714,409 new books printed in English in 2015.[1] Of these, just 221,597 (8.2%) were classified as fiction. This alone surprised me---I had always assumed that fiction controlled a significantly larger portion of publishing considering how much of the global conversation about books is driven by it. But, based on a Nielsen report,[2] the ratio of fiction releases to sales is not one-to-one; even though only about 8% of publishing is fiction, the category accounts for 23% of all book sales. (Also worth noting here is another surprise from that report, at least from the perspective of someone cloistered in an English department: just 47% of Americans[3] buy books of any kind in any format, and a huge number of them were adult coloring books last year.)

Bowkers's 2015 ratio (8.2% of publishing categorized as "fiction") does not seem to have been too far outside of the norm for the last six years:

As this chart shows, the data Bowkers collects on book sales has varied dramatically over the last sixteen years, starting with that sharp uptick in 2009-10 before declining again. It's hard to know whether that spike accurately reflects a year of unprecedented book publication, or if instead it measures a change in Bowkers's counting methodology. After all, 2009-10 seems like it would have been a bad time economically to quintuple your book printing. But it also came near the beginning of on-demand printing---those physical reprints of out-of-copyright texts by no-name publishers, sometimes literally just printing off scanned page images from Archive.org and gluing them together.[4] This could have greatly inflated the number of "new" books being printed, but it's hard to tell what percentage of the texts from those years and after fall into that category.

Thankfully for our purposes here, the absolute variance in Bowkers's data does not particularly matter since what we need is not a count of books but rather a ratio of fiction to total print production.[5] During this period, fiction was never more than 16.3% (2004) nor less than 2.5% (2010) of a given year's printing. On average, about 11% of books published in a given year were fiction. Without the outlier years, that dips slightly to 10.6%.

That gives us a ratio of fiction to nonfiction production within the contemporary book market. Roughly 1 in 10 books printed will be categorized "fiction," a set that contains a range of materials, including novel-length literary fiction, novellas, short story collections, young adult novels, romance, science fiction, fantasy, translations, etc.

To the best of my knowledge we lack a reliable means of estimating historical fiction/nonfiction print ratios. So, my first major assumption will be to map the average contemporary ratio of fiction to total print production from Bowkers onto a measure of total print production. Clearly this will produce a *very *rough result. But if we can assume that the contemporary moment reflects an average or lower-than-average ratio of fiction to nonfiction print production, then using the current ratio will point us toward a larger goal of this exercise: estimating the number of novels in English without overshooting the mark.

Given the contemporary ratio of fiction to nonfiction in print, we now need to know how many printed books we ought to be considering. If you filter Google Books for English language works today, the search engine returns an estimated 189 million books, a 146% increase from Google's 2010 estimate of total extant volumes globally.[6] Of course, this too underestimates the field since it presumably only references the collections Google has access to. Applying the ratio of fiction production we derived from Bowker's to this measure of total published output would leave us about 18.9 million books in English that Bowkers would categorize as fiction.[7]

"Books" turns out to be a key word in that last sentence. Bowkers's "Books in Print" is precisely what it sounds like: a database about books published, not works written. Because it privileges the book-as-product, the dataset does not allow us to easily differentiate between new novels and new versions of an extant novel. I use "versions" rather than "editions" or "printings" advisedly since Bowkers tracks paper-and-ink books, on-demand printing, digital copies of trade books, Kindle Direct Publishing (Amazon's self-publishing wing), etc. Localization also plays a major role in counting: The Color Purple and The Colour Purple count as two books, though I'm quite sure we would think of them as one novel. Worse, there is no way to readily decide from the metadata whether two different editions of a book titled The Portrait of a Lady both contain the same Henry James novel. We could assume based on a set of fuzzy title-author matches, but that becomes immediately ambiguous: Could we set parameters to reliably find that an item titled *The Portrait of a Lady: A Novel *is the same as Portrait of a Lady? Or, as a more genuine question of literary history rather than one about metadata, should we count *The Portrait of a Lady: New York Edition *as the same novel as The Portrait of a Lady?[8]

To suss out the contents of the fiction category we need a sample of the total texts. I copied the first 500 records (the max allowed by Bowkers) from the 2015 fiction works, sorted by the date the record was last updated. Of the sorting options, this seemed to offer the greatest degree of randomness, though a truly random sample from the 222,686 records would of course have been much better.

Reading through those records, I only recognized a few by title: Blood Meridian (McCarthy), Plainsong (Haruf), The Diaries of Adam and Eve (Twain), The Savage Detectives, and* 2666*. The fact that these last two are by Bolaño shows one clear limit of relying on date edited as a randomizing field.

To give you a sense of the range, here are a few other titles from that group:

  • The Book that Proves Time Travel Happens
  • Rio de Janeiro! #5
  • Chicken and Pickle: Get a Baby
  • Everything is Teeth

A huge number of books on the list were movie and television tie-ins from franchises like Star WarsThe Princess DiariesThe MinionsThe AvengersWalking DeadShrekMadagascar, and Doctor Who, among others. But there were also a few other titles that had been classed as fiction, but seem to be about fiction rather than fiction themselves:

  • Japanese Science Fiction: Views of a Changing Society
  • The Transhuman Antihero: Split-Natured Protagonists in Speculative Fiction from Mary Shelley to Richard Morgan
  • The Angel and the Cad: Love, Loss and Scandal in Regency England

Of those 500 items, 211 (42%) were duplicate entries referencing the same work (i.e. *Colour Purple */ Color Purple). Duplicate entries seem to primarily be the result of localizations and book type (hardcover vs. softcover vs. ebook). If we subtract those duplicates and the titles like the ones above about fiction rather than fictional works themselves, that leaves us with 285 possibilities. Of those, if we cut from there with a top-level BISAC code of Fiction, we're left with 128 possible novels. This seems reasonable if we're interested in the novel as distinct from "juvenile fiction" (275 of the items in the sample).

The genre breakdown of that group in this sample is as follows:

A few items to note about this chart. BISAC Fiction includes a wide range of categories not represented in this sample.[9] This includes non-novel fiction like short stories, anthologies, classics (as in Greek tragedy, not Penguin Classics), etc. So if we assume that the ratio of BISAC Fiction to Bowkers Fiction holds over the set, there would still be some percentage of non-novel Fictions, though they do seem to be rare. The subcategory also includes many forms of genre fiction, which, taken together, outweigh so-called General fiction, frequently the label used for literary fiction. Notably, the BISAC Code Fiction / Literary did not appear once in the sample, though some literary fictions did (e.g. *Blood Meridian *was categorized as Western, 2666 as General, etc.)

Based on this sample, roughly 25% of everything Bowkers categorized as Fiction could possibly be a novel. That takes the initial figure of 18.9 million possible fictional works down to 4.8 million. If cutting that proportion to get from "books" to "works" seems outlandish, consider this: According to Bowkers's, Zora Neale Hurston, James Joyce, and Henry James published a combined 123 books of fiction in 2015, 55 years after the youngest of them died. Over the time-period that Bowkers's full database covers, Henry James has been listed as the author of 14,829 books of fiction. I repeat: Based on the way Bowkers counts, Henry James "authored" 14,829 books since the 1990s. Compared to the 23 novels included in the Library of America's complete printing of James's novels, the ratio of unique book-length works by James to books attributed to James is about 0.16%.

Among novelists who have had large numbers of unique books printed, James seemed to me like he ought to rank quite highly considering his prolific output. I was curious who, if anyone, had more books to their name, so I looked up some of the highly ranked names from the Literary Lab's Popularity/Prestige project:[10]

Predictably, Shakespeare appears at the top of the list. But quite a few of these placements surprised me: Twain has been printed far more than other 19th century novelists like Austen, Eliot, and Melville, who also wrote a fairly large number of books. Faulkner and Hemingway appear surprisingly far down the list, being published more like J.K. Rowling than Fitzgerald, Woolf, and Cather.

To get at the problem of the "unique novel" we need to cut aggressively against the 4.8 million printed novels proposed earlier to account for authors with many print runs, but here we run to the end of our rope. If we had the data, we could get novel counts for a list of highly printed novelists against their total number of novels and subtract overprinting from the total.

But running up against this blockade (or, rather, the inflection point between diminishing returns and increasingly dubious assumptions) allowed me to pause and reflect on what we have learned at this point. We're within an order of magnitude: the total number of novels in English is closer to 5 million than 500,000 or 50 million. We also know that the floor is in the hundreds of thousands since the Library of Congress holds more than 207,000 fiction items[11] and the British Library returns over 390,000 books containing "fiction" anywhere in the object description.[12] For "novel," those numbers are 139,000 and 66,000 respectively---surprisingly small considering the size of the corpora we have become accustomed to working with in the Lab.

I also reflected on whether and how this figure relates to my initial question, considering the data that is actually available. I started off this post by asking, "How many novels have been published in English?" Based on the data I wound up using in the attempt, I rewrote the initial question to see what this process actually "answered." This is as close as I got: "Based on a ratio of fiction to nonfiction production---derived in part from a sampling methodology that selected for works that are likely novels that is then then applied to a rough measure of total publication and subselected against non-novel fictions---how many novels have been published in English, within an order of magnitude?" Self-flagellation by qualification.

Imprecise, presentist, and biased toward the published and the archived as it may be, what does having an order of magnitude tell us about the genre of the novel?

To answer that question, it helps to think about that number from the perspective of the reader who opened this essay. If you were something quite a bit more than voracious in your reading, and managed to get through a new novel every day for 50 years without letup, you would have read more than 18,000 "loose, baggy monsters," which is 8% of our lowest estimate and 0.3% of the highest. Literary critics, by contrast with this imagined reader, might know 200 novels quite well, giving them purchase on somewhere between 0.1% and 0.004% of the field. Even as we specialize by nation and century, the comprehensiveness of critics' reading only increases by portions of a percent.[13]

The question that emerges (and one that cannot be addressed in this space) is whether so little is, in fact, enough. The books that get read in literature departments may exist a space marginal to the marketplace of books that Bowkers tallies, but not in one entirely disconnected from it. When you're trying to understand a phenomenon like the novel from a sample that's both that small and deliberately nonrepresentative, does knowing its broadest dimension oblige us to ask about the other 99.9%?[14]

[1] This methodology expands on the data set used in Figure 1 of Pamphlet 8, "Between Canon and Corpus" and continues an interrogation from the section on archival bias and representativeness broached in Pamphlet 11, "Canon/Archive." Lastly, it extends a few ideas from a post by Matthew Wilkens: https://mattwilkens.com/2009/10/14/how-many-novels-are-published-each-year/

Queries were performed at http://www.booksinprint.com/ in December of 2016 and should be reproducible with small variance from changes in the database since.

Query structure: Date range 2015-01-01 to 2015-12-31; Language: English. The same date and language filters were applied to each search (changing the years as needed), and adding or removing the Fiction book type.

[2] Page 32 of this report.

[3] Unfortunately, the Nielsen report doesn't disaggregate the category of "Americans" to help us better understand this alarming statistic. For instance, does "Americans" include young children who likely don't buy anything?

[4] See, as an example of the on-demand publishing form, the "Paige M. Gutenberg" machine in the Harvard bookstore: http://www.harvard.com/clubs_services/books_on_demand/

[5] Notably, the fiction/print ratio in the first five years of this dataset is significantly higher than in the last five years. Hard to say if this reflects a shift in the publishing industry or Bowkers's counting.

[6] Query performed in November, 2016. As of now on the Google frontend, you cannot filter the Google Books corpus for works tagged by language without a character-based query, so this number is an estimate of books in English containing the word "the." As the most common word in English, "the" should put us within the margin of error, though there exist English books without it (e.g. Gilbert Adair's 1995 translation of Georges Perec's A Void, a novel written entirely without the letter "e" both in Perec's French and Adair's English.)

[7] This is quite crude, though changing to an average ratio over the short period of time covered by Bowkers does not seem better.

[8] For those not familiar, in his later years James edited many of his novels for release in a set known as The New York Edition. Many novels underwent fairly substantial changes during the editing process (frequently for the worse in the view of some James scholars).

[9] http://bisg.org/page/Fiction

[10] It should be pointed out here that this chart represents all books printed and documented by Bowkers's in all languages for a given author, not just English.

[11] https://www.loc.gov/search/index/subject/?q=the&all=true

[12] http://explore.bl.uk/primo_library/libweb/action/search.do?dscnt=0&vl(10130439UI0)=any&vl(drStartDay4)=00&vl(drEndMonth4)=00&scp.scps=scope%3A(BLCONTENT)&tab=local_tab&dstmp=1482018469320&srt=rank&mode=Advanced&vl(drEndDay4)=00&vl(1UIStartWith1)=contains&tb=t&indx=1&vl(41497491UI2)=any&vl(freeText0)=fiction&fn=search&vid=BLVU1&vl(freeText2)=&vl(drEndYear4)=Year&frbg=&ct=search&vl(drStartMonth4)=00&vl(10130438UI1)=desc&vl(1UIStartWith2)=contains&dum=true&vl(1UIStartWith0)=contains&vl(46690061UI3)=all_items&Submit=Search&vl(freeText1)=&vl(drStartYear4)=Year

[13] Randall Munroe of xckd has also addressed this question from the perspective of reading a subset of authors rather than a genre like the novel, finding that if you read 16 hours a day, you could keep up with "400 living Isaac Asimovs:" https://what-if.xkcd.com/76/

[14] Or: Wouldn't Sisyphus have wanted to know how high the hill was?

  •  

Distributions of words across narrative time in 27,266 novels

Over the course of the last few months here at the Literary Lab, I've been working on a little project that looks at the distributions of individual words inside of novels, when averaged out across lots and lots of texts. This is incredibly simple, really -- the end result is basically just a time-series plot for a word, similar to a historical frequency trend. But, the units are different -- instead of historical time, the X-axis is what Matt Jockers calls "narrative time," the space between the beginning and end of a book.

In a certain sense, this grew out of a project I worked on a couple years ago that did something similar in the context of an individual text -- I wrote a program called Textplot that tracked the positions of words inside of novels and then found words that "flock" together, that show up in similar regions of the narrative. This got me thinking -- what if you did this with lots of novels, instead of just one? Beyond any single text -- are there general trends that govern the positions of words inside of novels at a kind of narratological level, split away from any particular plot? Or would everything wash out in the aggregate? Averaged out across thousands of texts -- do individual words rise and fall across narrative time, in the way they do across historical time? If so -- what's the "shape" of narrative, writ large?

This draws inspiration, of course, from a bunch of really interesting projects that have looked at different versions of this question in the last couple years. Most well-known is probably Matt Jockers' Syuzhet, which tracks the fluctuation of "sentiment" across narrative time, and then clusters the resulting trend lines into a set of archetypal shapes. Andrew Piper, writing in New Literary History, built a model of the "conversional" narrative -- based on the Confessions, in which there's a shift in the semantic register at the moment of conversion -- and then traced this signature forward through literary history. And, here at Stanford, a number of projects have looked at the movement of different types of literary "signals" across the X-axis of narrative. The suspense project has been using a neural network to score the "suspensefulness" of chunks of novels; in Pamphlet 7, Holst Katsma traces the "loudness" of speech across chapters in The Idiot; and Mark Algee-Hewitt has looked at the dispersion of words related to the "sublime" across long narratives.

Methodologically, though, the closest thing is probably Ben Schmidt's fascinating "Plot Arceology" project, which does something very similar except with movies and TV shows -- Schmidt trained a topic model on a corpus of screenplays and then traced the distributions of topics across the scripts, finding, among other things, the footprint of the prototypical cop drama, a crime at the beginning and a trial at the end. I was fascinated by this, and immediately started to daydream about what it would look like to replicate it with a corpus of novels. But, picking up where Textplot left off -- what could be gained by taking a kind of zero-abstraction approach to the question and just looking at individual words? Instead of starting with a higher-order concept like sentiment, suspense, loudness, conversion, sublimity, or even topic -- any of which may or may not be the most concise way to hook onto the "priors" that sit behind narratives -- what happens if you start with the smallest units of meaning, and build up from there?

It's sort of the lowest-level version of the question, maybe right on the line where literary studies starts to shade into corpus linguistics. Which words are most narratologically "focused," the most distinctive of beginnings, endings, middles, ends, climaxes, denouements? How strong are the effects? Which types of words encode the most information about narrative structure -- is it just the predictable stuff like "death" and "marriage," or does it sift down into the more architectural layers of language -- articles, pronouns, verb tenses, punctuation, parts-of-speech? Over historical time -- do words "move" inside of narratives, migrating from beginnings to middles, middles to ends, ends to beginnings? Or, to pick up on a question Ted Underwood posed recently -- would it be possible to use this kind of word-level information to build a predictive model of narrative sequence, something that could reliably "unshuffle" the chapters in a book? It's like a "basic science" of narratology -- if you just survey the interior axis of literature in as simple a way as possible, what falls out?

Stacking texts

One nice thing about this question is that the feature extraction step is really easy -- we just need to count words in a particular way. At the lowest level -- for a given word in a single text, we can compute its "dispersion" across narrative time, the set of positions where the word appears. For example, "death" in Moby Dick:

So, just eyeballing it, maybe “death” leans slightly towards the end, especially with that little cluster around word 220k? Once we can do this with a single text, though, it’s easy to merge together data from lots of texts. We can just compute this over and over again for each novel, map the X-axis onto a normalized 0-1 scale, and then stack everything up into a big vertical column. For example, in 100 random novels:

Or, in 1,000:

And then, to merge everything together, we can just sum everything up into a big histogram, basically – split the X-axis into 100 evenly-spaced bins, and count up the number of times the word appears in each column. It’s sort of like one of those visualizations of probability distributions where marbles get dropped into different slots – each word in each text is a marble, and its relative position inside the text determines which slot the marble goes into. At the end, everything stacks up into a big multinomial distribution that captures the aggregate dispersion of the word across lots of texts. Eg, from the sample of 1,000 above:

This can then be expanded to all 27,266 texts in our corpus of American novels – 18,177 from Gale’s American Fiction corpus (1820-1930), and another 9,089 from the Chicago Novel Corpus (1880-2000), which together weigh in at about 2.5 billion words. For death:

So it’s true! Not a surprise, but useful as a sanity check. Now, with “death,” it happened that we could already see a sort of blurry, pixelated version of this just with a handful of texts. The nice thing about this, though, is that it also becomes possible to surface well-sampled distributions even for words that are much more infrequent, to the degree that they don’t appear in any individual text with enough frequency to infer any kind of general tendency. (By Zipf’s law, this is a large majority of words, in fact – most words will just appear a handful of times in a given novel, if at all.) For example, take a word like “athletic,” which appears exactly once in Moby Dick, about half-way through:

And, even in the same sample of 1,000 random novels, the data is still very sparse:

If you squint at this, maybe you can see something, but it’s hard to say. With the full corpus, though, the clear trend emerges:

"Athletic" -- along with a great many words used to describe people, as we'll see shortly -- concentrates really strongly at the beginning of the novel, where characters are getting introduced for the first time. If someone is athletic, it tends to get mentioned the first time they appear, not the second or third or last.

Significance, "interestingness"

Are these trends significant, though? For "death" and "athletic" they certainly look meaningful, just eyeballing the histograms. But what about for a word like "irony":

Which looks much more like a flat line, with some random noise in the bin counts? If we take the null hypothesis to be the uniform distribution – a flat line, no relationship between the position in narrative time and the observed frequency of the word – then the simple way to test for significance is just a basic chi-squared test between the observed distribution and the expected uniform distribution, where the frequency of the word is spread out evenly across the bins. For example, “death” appears 593,893 times in the corpus, so, under the uniform assumption, we’d expect each of the 100 bins to have 1/100th of the total count, ~5,938 each. For “death,” then, the chi-squared statistic between this theoretical baseline and the observed counts is ~16,925, and the pvalue is so small that it literally rounds down to 0 in Python. For “athletic,” chi-squared is ~1,467, with p also comically small at 3.15e-242. Whereas, for “irony” – chi-squared is 98, with p at 0.49, meaning we can’t say with confidence that there’s any kind of meaningful trend.

Under this, it turns out that almost all words that appear with any significant frequency are non-uniform. If we skim off the set of all words that appear at least 10,000 times in the corpus (of which there are 10,908 in total) – of these, 10,513 (96%) are significantly different from the uniform distribution at p<0.05, 10,227 (94%) at p<0.01, and 9,815 (90%) at p<0.001. And even if we crank the exponent down quite a lot - at p<1e-10, 7,830 (72%) words still reject the null hypothesis. What to make of this? I guess there's some kind of very high (or low) level insight here - narrative structure does, in fact, manifest at the level of individual words? Which, once the numbers pop up in the Jupyter notebook, is one of those things that seems either interesting or obvious, depending on how you look at it. But, from an interpretive standpoint, the question becomes - if everything is significant, then which words are the most significant? Which words are the most non-uniform, the most surprising, which encode the most narratological information? Where to focus attention? How to rank the words, essentially, from most to least interesting?

This seemed like a simple question at first, but over the course of the last couple months I’ve gone around and around on it, and I’m still not confident that I have a good way of doing this. I think the problem, basically, is that this notion of “interestingness” or “non-uniformity” is actually less cut-and-dry that it seemed to me at first. Specifically, it’s hard to meaningfully compare words with extremely different overall frequencies in the corpus. It’s easy to compare, say, “sleeping” (which is basically flat) and “ancient” (which has a huge spike at the beginning), both of which show up right around 100,000 times. But, it’s much harder to compare “ancient” and “the,” which appears over 100 million times, and represents slightly less than 5% of all words in all of the novels. This starts to feel sort of apples-to-oranges-ish, in various ways (more on this later), and is further confounded by the fact that the data gets so sparse at the very top of the frequency chart – since a small handful of words have exponentially larger frequencies than everything else, it’s harder to say what you’d “expect” to see with those words, since there are so few examples of them.

To get a sense of how this plays out across the whole dictionary – one very simple way to quantify the “non-uniformity” of the distributions is just to take the raw variance of the bin counts, which can then be plotted against frequency:

This is unreadable with the linear scales because the graph gets dominated by a handful of function words; but, on a log-log scale, a fairly clean power law falls out:

But, with that really wide vertical “banding,” which is basically the axis of surprise that we care about – at any given word frequency on the X-axis, words at the bottom of the band will have comparatively “flat” distributions across narrative time, and words at the top will have the most non-uniform / narratologically interesting distributions.

The nice thing about just using the raw variance to quantify this is that it’s easy to compare it against what you’d expect, in theory, at any given level of word frequency. For a multinomial distribution, the variance you’d expect to see for the count in any one of the bins is n * p (1-p), where n is the number of observations (the word count, in this context) and p is 1/100, the probability that a word will fall into any given bin under the uniform assumption. Almost all of the words fall above this line:

Which, to loop back, corresponds to the fact that almost all words, under the chi-squared test, appear not to come from the uniform distribution – almost all have higher variances than you’d expect if they were uniformly distributed.

I’m unsure about this, but – to get a crude rank ordering for the words in a way that (at least partially) controls for frequency, I think it’s reasonable just to divide the observed variances by the expected value at each word’s frequency, which gives a ratio that captures how many times greater a word’s actual variance is than what you’d expect if it didn’t fluctuate at all across narrative time. (Mathematically, this is basically equivalent to the original chi-squared statistic.)

So, then, if we skim off the top 500 words:

Does this make sense, statistically? I don’t love the fact that it still correlates with frequency – almost all of the highest-frequency words make the cut. But that might also just be surfacing something true about the high frequency words, which do clearly rise up higher above the line. (Counterintuitively?) There are other ways of doing this – namely, if you flatten everything out into density functions – that reward low-frequency words that have the most “volatile” or “spiky” distributions. But, these are problematic in other ways – this is a rabbit hole, which I’ll try circle back to in a bit.

Anyway, under this (imperfect) heuristic, here are the 500 most narratologically non-uniform words, ordered by the “center of mass” of the distributions across narrative time, running from the beginning to the end. There’s way too much here to look at all at once, but, in the broadest sense, it looks like – beginnings are about youth, education, physical size, (good) appearance, color, property, hair, and noses? And endings – forgiveness, criminal justice, suffering, joy, murder, marriage, arms, and hands? And the middle? I gloss it as a mixture of dialogism and psychological interiority – “say,” “think,” “feel,” and all the contractions and dialog punctuation marks – though it’s less clear-cut.

The really wacky stuff, though, is in the stopwords – which deserve their own post.

The feature extraction code for this project can be found here, and the analysis code is here. Thanks Mark Algee-Hewitt, Franco Moretti, Matt Jockers, Scott Enderle, Dan Jurafsky, Christof Schöch, and Ryan Heuser for helping me think through this project at various stages. Any mistakes are mine!

  •  

A hierarchical cluster of words across narrative time

I wanted to pick back up quickly with that list of the 500 most "non-uniform" words at the end of the last post about word distributions across narrative time in the American novel corpus. Before, I just put these into a big ordered list, arranged by the center of mass of each word's distribution, which gives a pretty good sense of the conceptual gradient from beginning to end. But, it's easy to see that the center-of-mass metric is papering over some interesting differences. For example, "girls" sits right next to "brick," both of which are clearly beginning words, in the sense that they're high at the beginning and low at the end:

But, in terms of the actual shape of the distribution, “girls” looks much closer to “manners,” which sits nine positions to the left, or “liked,” seventeen positions to the right:

"Brick" has a huge spike at the very beginning, presumably being used in the context of describing houses, but then is basically flat across the rest of the text; whereas "girls" maybe actually peaks just after the beginning, and then fall off linearly across the narrative. This seems like a meaningful difference -- I'd suppose, "girls" is somehow contributing less to the work of "world-building," the process of rendering the fictional world into existence at the very start, and marking something else. (But what?)

How to hook onto these kinds of distinctions more precisely? Beyond the (literally) one-dimensional notion of a "center" or "mean" of a word, how to slice the dictionary into groups and cohorts, little rivulets that run through the prototypical narrative? To circle back to the original question from Textplot, back in 2014, but now applied to a big stack of 27k novels instead of just one -- which words "flock" together across narrative time, ebb and flow in the most exactly similar patterns? Again, at a conceptual level, this is largely a replication of Ben Schmidt's analysis of the distributions of topic models across screenplays, and David Mimno's experiments with plotting topic models across novels (using data from Matt Jockers' Macroanalysis).

Though, coming from a slightly different direction, and also drawing inspiration from what Ryan Heuser and Long Le-Khac did back in Pamphlet 4 with the "Correlator" program. Instead of starting with topics in the normal sense -- groups of words that tend to show up in close proximity in individual texts -- I was curious what would happen if I clustered words just on the basis of their cumulative distributions across lots and lots of texts, regardless of whether they actually hang together inside of individual novels. (Similar to Ryan and Long's notion of a "semantic cohort," a group of words that correlate in overall frequency across historical time.) If we just start with individual words, and build up from there -- which groupings of words are the most "cohesive," at a narratological level? What pops out most strongly, which combinations of words do the most narratological work?

One simple approach is just to do a basic hierarchical cluster of the distributions. Here, I converted the raw percentile counts for each word into density functions, and then just took the raw euclidean distance between each pair of words. (As I mentioned before, this is iffy when comparing words with very large differences in overall frequency, and, in this case, has the effect of lumping in all of the high-frequency words with the "middle" words, even when they actually have really interestingly skewed distributions. But again -- this is another can of worms.) Then, I handed the distance matrix over to SciPy's [dendrogram](https://docs.scipy.org/doc/scipy-0.14.0/reference/generated/scipy.cluster.hierarchy.dendrogram.html) function to compute the hierarchical cluster, using the "ward" linkage method. I ended up running this on the 1,000 most non-uniform words, not just the top 500, which gives a bit more specificity to some of the clusters. The final render is huge (click to show full size):

The nice thing about hierarchical clustering is that you don’t have to make many decisions going in – just the distance and linkage metrics. But, the downside is that interpreting this is a bit subjective, mainly because there’s no hard-and-fast answer as to where you should “cut” the dendrogram, how high up the tree you should go before breaking off a cluster of words to look at. Here, I’ve set the coloring threshold at 0.01, meaning that any words / groups that were merged together with a distance of less than 0.01 (under the “ward” metric) get the same color. This seems to give fairly sensible clusters for this data – here are plots for all of these clusters with at least 3 words. (Important to note that the Y-axes are different here, which I dislike, but I think is the lesser of two evils in this case, since a handful of huge effects would otherwise make it hard to see more subtle but still very strong trends.)

Really this is probably a bit too granular, since there are a number of groups that have similar profiles and seem to hang together at some kind of topical / conceptual level. But, I think it's useful to err in the direction of too granular instead of too coarse, since there are some cases where the lower threshold splits out groups that seem interestingly different (for example, the "family" and "dialogue" words, discussed below).

Beginnings

Here's my less-than-scientific gloss on this, where, in the interest of shortness, I've often merged a handful of groups back together into higher-order groups. To start, at the beginning -- there's a big cohort of words that all have something to do with the description of people and objects -- age (sixteen, seventeen, eighteen, younger, older), body size (tall, stout, slender), personal qualities (graceful, educated), physical materials (wooden, leather, cotton), etc. These peak out in the first percentile, fall off sharply in the first ~10%, and then decline more gradually across the middle, with some spiking slightly again at the very end:

This makes sense – the fictive world has to get sketched into existence at the start; a movie or play can just show things, but a novel has to explicitly describe them, the novelist has to manually “render” the world of the story.

Education also happens at the very beginning, though the word “education” itself also ticks up slightly at the end, which I’m not sure about – maybe education in a more general sense, the protagonist having received an education of some sort over the course of the plot, not education in the literal sense of school, college?

Beyond words that just show up at the beginning – there’s an interesting set of clusters that are strong at the very beginning, flat across the middle of the text, but then also high at the very end. These all have to do with physical setting, essentially – cardinal directions (north, south, east, west, northern, southern), features of the physical landscape (mountains, fields, hills, waters), actual place names (America, American, England, York), and the sort of human experience of the outdoors (sky, horizon, wide, vast, distant).

Which I guess goes hand-in-hand with the descriptions of people and things -- this is the narrative hammering together the "stage" of the narrative, in the broadest sense, the place of the text. Though, the spike at the ending is less clear to me. Why return to the physical setting at the very end, once when the world has already been blocked into existence by the beginning? (And surely, at the end, the narrative isn't crossing into new fictive territory that needs to be described for the first time?) Maybe, to use film as an analogy -- if we think of the narrative as a kind of "camera" onto the world, this is the camera panning out at the end, pulling back into a wide shot of the landscape of the story -- the characters gazing out contemplatively over the mountains, plains, valleys, seas? A kind of reciprocal "wide shot" to match the scene-setting of the beginning? Like in Howards End, maybe, when, at the very end, everyone goes outside and looks at the "field" and "meadow" behind the house. The last two paragraphs:

From the garden came laughter. "Here they are at last!" exclaimed Henry, disengaging himself with a smile. Helen rushed into the gloom, holding Tom by one hand and carrying her baby on the other. There were shouts of infectious joy.

"The field's cut!" Helen cried excitedly--"the big meadow! We've seen to the very end, and it'll be such a crop of hay as never!"

Or, to stick with Forster, the last paragraph of A Room with a View:

Youth enwrapped them; the song of Phaethon announced passion requited, love attained. But they were conscious of a love more mysterious than this. The song died away; they heard the river, bearing down the snows of winter into the Mediterranean.

Along the same lines -- "sun," "sunlight," and "sunshine" are high at the beginning and the end:

But also “clouds,” “snow,” and “shadows,” which, unlike sunshine, are flat across the middle, instead of falling off to a low point around 80%. (Not sure how much can be made of those kinds of small differences, which could always just be noise in the sample. Though also not sure that nothing should be made of them, since N here isn’t small.)

Words related to family are also strong at the beginning, though with a twist – unlike the description words, which are highest in the very first percentile, family words start relatively lower and then spike up to a peak in the second, third, fourth percentiles, before falling off more gradually across the first half of the narrative and then rising slightly at the end. As if – the narrative starts with world-building, and then turns to characters, where the first order of business is to lay out the family tree, fill in the edges of the graph?

This also seems to have something to do with childhood and youth, with “mama,” “mamma,” “papa.” Though interestingly, words explicitly about children and childhood break off cleanly into a separate cluster, which rises much higher at the end:

Again, "childhood" at the beginning makes sense -- narratives map onto lives, are told in chronological order, etc. And I suppose that "childhood" at the end is, basically, the consummation of the marriage plot? "Childhood" in the first percentile is the childhood of the protagonist, and "childhood" in the 99th percentile is the childhood of his/her children?

10%

Next in order, moving away from the start -- a series of clusters of words related to entertainment, fashion, social interaction, and, notably, women, all of which rise quickly at the start, reach a relatively broad peak around 10%, and then fall of in a sort of convex arc. First, with the highest peak, around 10-15% -- "girls," "amused," "amusement":

Or, “girl,” “pretty,” “wear,” “dress”:

And, with somewhat less of that initial rise in the first couple percent, “women,” “clothes,” “table,” “manner”:

Along with women and fashion, this is also very notably the arc of food, which creeps in above with “fish” and “table.” Also peaking around 10% – “breakfast,” “supper,” “meal,” “beer,” “coffee,” “tea”:

And, interestingly, a fairly distinct second food cluster, which rises more gradually to a peak around 20% – “lunch,” “wine,” “eat,” “dinner,” and also words like “conversation,” and “dance” – which make me think of soirees, dinner parties, balls, gatherings that are more formal, that take place at night?

So, a kind of anatomy of beginnings starts to come into view. First, descriptions of physical setting, places, things, weather, and (the appearance of) people; then family relations and childhood. And then, once the work of world-building is complete, once the stage and props and characters have been described into existence -- it's as if the narrative kicks off in earnest with some kind of social gathering or a meal, a first scene or set piece where the characters (mostly women?) are shown dressed fashionably, sitting around the table, at ease and enjoying themselves, before the complications of the plot ensue -- Anna Pávlovna's soiree, at the start of War and Peace, the first dinner at the Bertolini in A Room with a View? A meal at 10%, a dance at 20% -- how many individual novels do this?

90%

Meanwhile, at the end -- first of all, sort of mirroring the food / amusement cohorts that peak just after the start -- a series of clusters that peak just before the end, around 90-95%, all having something to do with violence. The highest peak is murder, generally with guns:

And the trial, which looks very similar to what Ben Schmidt saw with the TV scripts, here probably driven by suspense and mystery novels:

And I think this is war – “enemy,” “attack,” “guard,” “escape”?

I guess these peaks are the "climax," basically?

Ends

Finally, at the very end, words that peak in the 99th percentile -- some endings are happy, filled with joy, happiness, tender embraces, kisses, eternal faithfulness:

Related, the marriage plot, which is the single strongest signal of any of these, just by the height of the spike:

And, Brooks / Barthes / Kermode and friends were right, endings also tend to be about death:

Middles?

What about the middle? Middles are relatively sparse, in this set of 1,000 words, though, in part, I think this is a function of how I'm skimming off words to look at, and how the counts were tallied up in the first place. Really just two things pop out, and, in both cases, it's not so much that the clusters are "peaking" in the middle, and more just that they're missing at the beginning and end. The most exactly middle-heavy cluster is probably this one, which clearly corresponds to dialogue -- quotation marks and contractions, and those " tokens, which are actually errors, places where the OpenNLP tokenizer is failing to split the quotation mark away from the first word in the sentence.

And this cluster, which is a little more ambiguous, but I think also marks conversation – “question,” “talk,” “why,” and more contractions:

Interestingly, there’s a third dialogue cluster, which looks broadly similar but peaks significantly later, around 80%, and, in addition to the dialogue tokens, also includes a set of words that seem to describe mental states or intentions – “understand,” “try,” “believe,” “know,” “feel,” “wish,” “want”:

Though it's interesting that "think" gets clustered with that first group, which peaks right in the middle.

So, middles are -- speaking and thinking, dialogue and psychological interiority? That rings true, but I also think it's probably not the full picture. First, it might be that the most middle-heavy words aren't making it into this cut of 1,000 words, which, as I mentioned before, is based on one particular scoring metric (among many possible alternatives) that tends to reward relatively frequent words.

More broadly, I also wonder if the process of normalizing the text lengths has the effect of sort of "blurring out" the structure of the middle, and giving clear pictures of just the beginning and the end. For example, imagine that there were some kind of event / function / trope that tends to happen at a fixed, not relative, distance from the beginning or end -- eg, a thunderstorm always happens right around 10,000 words from the beginning, or whatever. If the novel is 50,000 words long, this would get mapped onto the 20% marker. But, if the novel is 100,000 words long, it would get put at 10%, etc. This seems clearly problematic, but I also don't think there's an easy solution that doesn't introduce other problems. For example, if we don't normalize the lengths at all, and compare the 50,000 word novel directly to the 100,000-word novel -- then, words at the very end of the 50k novel would get compared to words at the exact middle of the 100k novel, which also seems weird. (Though I'd be curious to try this anyway, and see what happens, possibly starting from different fixed "anchor points" in the narrative -- plot time-series trends for words in terms of raw distance from the beginning, moving forward; from the end, moving backwards; or from the 25% / 50% / 75% markers, moving backwards and forwards, etc.)

Anyway though, most of this isn't super surprising. Where it gets more interesting, I think, is with the really high-frequency function words, which turn out to have very irregular trends across the narrative, often in ways that seem to give a kind of keyhole view onto something more fundamental, a kind of underlying narrative "physics" that sits below the birth / death / murder / marriage conventions. I'll write more about this next, but quickly -- check out "and" and "or":

  •  

The (weird) distributions of function words across novels

Last week I looked at some of the clusters of words that fluctuate together across narrative time in the Lab's corpus of ~27k American novels. A lot of these are pretty semantically "legible," in the sense that it's not hard to map them back onto the experience of actually reading novels. For example, it's easy to reason about what's going on with cluster 139 (student, students, school) or 37 (pistol, bullet, gun). Which, as Ted and Scott pointed out on Twitter, might tell us more about the presence of different genres in the corpus than about "narrative," in any kind of general sense.

But, what to make of something like cluster 10? This seems more muddled, and, notably, includes a number of stopwords – “a,” “an,” “or,” “than,” “these”.

Which, it turns out, isn’t a fluke. Function words tend to have very strong trends across narrative time. In fact, stronger than almost anything else in the dictionary. Take a look again at this graph from a couple weeks ago, which plots the non-uniformity of each word as a function of its frequency:

The Y-axis is just the variance of the word's frequency across each percentile of the novel, which gives a crude measure of the unevenness of the word, the degree to which it's rising and falling across the narrative. The black line represents the null hypothesis, basically -- the amount of variance that we'd expect under the uniform distribution, if everything were just random noise. By dividing the observed variance by this theoretical baseline, we can get a simple score for the narratological volatility of the word, in a way that controls for the expected correlation with frequency.

Before, I focused on the fact that almost all of the words fall above this line, which corresponds to the fact that most words have some kind of statistically significant trend across the novel. But, beyond that, it's also clear that the slope of the data is steeper than the slope of the line -- words rise higher above the line as frequency increases. On the left side of the graph, the highest-scoring words sit about 2 orders of magnitude above the baseline; at the right side, this rises to about 3. Words seem to become more narratologically volatile as they become more frequent, even after adjusting for the expected relationship between frequency and variance.

Indeed, when we use this metric to skim off a set of the most non-uniform words, we end up getting a large majority of the most frequent words and a much smaller slice of the less frequent words. If we take the 200 highest-scoring words, for example, we get 60 out of the 100 most frequent words in the corpus, here in bold:

end, you, chapter, aofthei., chapter, ?, i., ii, years, "!saidme, iii, "him, young, she, 2, 3, hetoher, its, "will, i., father, school, whatand, hair, mother, god, age, ", tall, ), death, love, the, that, (, ,, year, brown, have, happy, now, life, itnotweyourin", happiness, an, new, joy, boy, or, 5, if, wedding, vii, dead, 6, again, ", old, family, do, blue, small, which, viii, l, iv, heart, large, did, published, book, gun, miss, girls, arms, do, 9, girl, would, ix, couldhis, tell, ", kill, bride, told, was, college, always, black, letter, has, 8, don't, canback, tears, know, author, last, forgive, shall, asked, go, be, die, mr., saw, had, broad, handsome, hand, gray, must, then, 7, about, fiction, think, n't, edition, books, boys, littlemyis, cried, their, us, younger, summer, older, prisoner, love, xii, 1, green, by, "you, stranger, vi, beauty, dying, grave, done, novel, village, readers, xiii, world, youth, 22, children, york, kissed, born, think, know, love, 13, mrs., town, rich, killed, story, 23, 21, still, 12, &, whose, very, wife, from, went, some, nose, 24, v., pain, see, like

What to make of this? It's kind of perplexing, and runs against what I expected at the start. I assumed that function words would be basically flat -- maybe with some very slight ups and downs -- since I don't really think of them as having any kind of narratological "valence" that would cause them to attach to beginnings / middles / ends in the way that things like death and marriage do. I thought they'd probably be negative examples of what I was looking for, almost -- the connective tissue of the language, always just there, never ebbing or flowing. (Though I also remembered Matt Jockers' finding from Macroanalysis that the word "the" rises and falls across historical time, and a little voice in my head wondered if there might be similar effects across narrative time.)

Usually, when something correlates with frequency like this, it feels like a red flag, the worry being that you're somehow just reproducing the fact that frequent words are frequent, infrequent words are infrequent. As a sanity check, and to get a sense of what the null hypothesis would look like, I re-ran the same feature extraction job on the corpus, but this time, before pulling out the percentile-sliced word counts for each text, I randomly shuffled the words to destroy any kind of narratological ordering. Sure enough:

So – as far as I can tell, I think there is actually some meaningful way in which the highest frequency words are some of the most skewed across the narrative, the most uneven, the most narratologically charged? This seemed really weird to me at first, then I convinced myself that it wasn’t actually that weird, and now I’m back to being surprised by it. But, I’m not sure. The effect is so strong, it makes me wonder – is it somehow inevitable, is there some kind of fundamental linguistic / literary / information-theoretic pressure that would make it impossible for this not to be the case, in some way?

Part of the issue, I think, is that this question of whether a word is narratologically “uneven” is actually less cut-and-dry than it seemed to me at first, and it gets caught up in interesting ways with the overall frequency of the word. For example, take “gun” and “a”:

“Gun” appears 174,286 times; “a” appears 44,510,387 times, about 255 times as often. Which of these is more “surprising”? At a kind of visual / intuitive level, “gun” obviously has the more dramatic trend – a huge spike around the 95% marker, where it literally doubles in volume relative to the baseline across the first half of the narrative. Indeed, if you convert them into probability density functions – throwing out any information about the overall frequencies – and then compare them to a uniform distribution using pretty much any goodness-of-fit test or distance metric, “gun” will always score higher by a large margin. Just using the Euclidean distance – “a” has a distance of 0.004 from the uniform distribution, whereas “gun” is 0.02, over 5x higher.

But, when you remember the actual footprint of "a" in the corpus -- 44 million occurrences, which represents about 1.8% of all words in all 27k novels -- the total quantity of linguistic "mass" that's getting displaced is sort of incredible. Here it is again, plotted this time with an error bar around the expected value of the uniform distribution -- if "a" had no trend across the plot, 95% of the bin counts would fall inside the gray band, which gets dwarfed by the actual data. In the first percentile, "a" appears 72 thousand times more than we'd expect under the uniform distribution, and 40 thousand fewer times in the last percentile. Which correspond to zscores of 109 and -61, respectively, which are absurdly large. (In fact so large, as Scott Enderle pointed out, that the uniform distribution almost feels like a meaningless / poorly-chosen null hypothesis. But, I'm not really sure what the alternative would be.)

Whereas for “gun,” the high-water mark at 95% has a zscore of 37, which of course is still huge:

“A” is flatter, but since it’s so frequent, it represents a kind of massive, tectonic displacement of words, sort of like the gravity of the moon pulling the tide in an out – the water only rises and falls a couple of feet, but in order for that to happen the entire mass of the ocean has to get moved around. The amount of narratological “energy” needed to produce the “a” trend seems much larger than for “gun,” from this perspective.

So, “gun” beats “a” in one way, but “a” beats “gun” in other ways. Which of this is more true? I spent some time going around in circles on this, but, as Dan Jurafsky and Ryan Heuser pointed out, there might not be a single right answer. Maybe more accurate just to say that there are different types of “surprise” at play, and that they operate differently at n=10^5 than at n=10^8?

To get a broader set of how that plays out across lots of words – out of the 100 most frequent words in the corpus, 90 appear in the list of the 1,000 most uneven words, under the metric from above. Here’s this list of 90, sorted from the most uneven to the least uneven, starting with the most narratologically skewed:

A vs. the

There’s too much here to go through all of it, but quickly – what’s up with “a”? There’s a remarkable symmetry to it – high at the very beginning, a fast falloff in the first 10%, a slower decline across the middle, and then a nosedive again at the very end. “An” is almost identical, though with more noise in the sample, since it’s less frequent:

There's a pretty easy explanation for this, though I'm kind of fascinated by the fact that it seems to show up at the scale of the entire narrative, and not just inside of individual passages -- "a" is used when an object is introduced for the first time, when an entity makes its first appearance in some context. For example, we might first say -- "a man was walking down the street" -- but then after that, once the man has been placed on the narrative stage, we'd switch to the definite article -- "the man walked into a shop," etc. (Franco pointed out that Benveniste makes exactly this point in Problems in General Linguistics.)

So, this is totally speculative, but -- maybe one way to think about this is to say that "a" is a proxy for the rate at which newness is getting introduced into the text? Most quickly at the start, as the fictional world is getting introduced for the first time. Then, over the course of the middle, the plot continues to move into new fictional space -- new people, new places, new objects -- but more slowly than at the beginning. And then slowest at the very end, where the plot doesn't have any space left to introduce new things. "A," in other words, gives a kind of empirical X-ray of the "speed" of the novel, in one sense of the idea -- the degree to which it's moving into new fictional contexts that have to be introduced for the first time, as opposed to standing still inside of contexts that have already been introduced? (Sort of like those old RPGs from the late 90s like Baldur's Gate or Icewind Dale, where by default the entire world of the game is black, and thing only come into view as your character moves around the map, as the spotlight falls onto new territory for the first time -- the moment of "a"?)

Is this the right explanation? I think it seems sensible, but I don't really know. The funny thing, though, is that it's not totally clear to me how you'd "prove" this, either at a linguistic or a literary register. Usually the next step would be to dip back down into individual texts and start spot-checking passages, but with a word like "a," which will appear literally millions of times in virtually all contexts, this seems like sort of a losing game. I guess the first thing would be to look at words that follow "a," and see if some kind of pattern falls out? Eg, count up all "a __" bigrams, and then find words that come after "a" most distinctively in the first percentile, as compared to the last percentile?

"The" is interestingly different:

Also very high at the start, a fast falloff in the first 10% (faster than “a”), comparatively low through the middle, and then a gradual rise at the end, starting at around 60%. So, “a” and “the” – flip sides of the same coin, grammatically – seem to do different work at a narratological level? Both seem to mark beginnings and ends, but in different ways. “A” shows something about how they are different – beginnings are building worlds, ends are inhabiting those worlds? Whereas, “the” is high at both the beginning and the end, and so, I guess, is marking something about how they are similar, a way in which the end is some kind of return to the beginning? But, in what sense?

I’m not sure about this, especially the ending. Weirdly, if we compare “the” to the combined trend for all nouns in the corpus, the ending doesn’t match up:

No idea, really. Again, to really get at this, we'd need to look at context -- the what? What words are following "the," in different parts of the narrative?

Determiners

Beyond "a" and "the" -- the other determiners are interesting:

So, at a narratological level, they basically pair up on the basis of singular / plural, not near / far. “This” and “that” are low at the beginning, peak around 70%, and then fall off at the end:

Whereas “these” and “those” are very high at the start, flat across the middle, and then split at the end, with “those” going up and “these” falling off:

JD pointed out that “this” and “that” look a lot like the dialogue clusters from last week, with the wide peak across the middle. As for “these” and “those” – I’m not sure why plurals would be so high at the beginning, but in this case it does seem to generally match up with the trend for nouns, where plurals are much higher at the start:

Though, the question then just becomes -- why plural nouns at the start? The divergence at the end is also interesting -- why does "those" spike up, and "these" fall off? Again, all of this needs much more careful attention, but -- picking up on the "geography" words from the last post, which spiked at the end -- this fits with the idea that the end is a sort of "zooming out," if we think of the narrative as a camera onto the fictional world? At the end, the narrative pans out into a wide shot of the surrounding mountains / fields / valleys, it makes itself distant from the action of the plot -- the domain of "those," not "these"?

Check out the "how much" determiners -- "all," "some," and "no" ("no" specifically as a determiner, in the sense of "there were no people in the room"):

“All” peaks at the end, the moment of generalization, completeness, closure? I’m less sure what to make of the fact that “some” peaks at 20%, but “no” at 80%:

Meanwhile, to close out the determiners – “each” skyrockets at 99%, whereas “every” stays low:

And vs. or

Conjunctions are also fascinating:

Again, there’s a tidy explanation for the split at the end, though I’m still sort of bewildered that this stuff actually shows up so strongly and at such a low level. “Or” introduces a potential branch in the narrative, a state of indeterminacy – Robert will blow the bridge, or he’ll die trying; Lucy will marry Cecil, or she will marry George; etc. And so, as the plot moves towards a close, “or” has to fall off as the ending is revealed, as uncertainty is replaced by certainty, as the plot gets sealed up as a unity and the Jamesian “circle” comes to a close?

To be

Moving on to verbs – a handful of “to be” verbs show up in the list of 90 above. Here’s everything together:

Which splits really cleanly into the present tense:

And the past:

So – the beginning is in the past tense, the middle in the present tense (dialogue, again?), but then the past tense peaks again around 95% (the climax, in some sense?), and then the present shoots back up at the very end.

Pronouns

Pronouns are also really varied. Subject and object pronouns are low at the start, rise gradually across the middle, and then kind of scramble at the end. Though, overall, the subject pronouns seem to plateau around 80%, whereas the object pronouns start to curve up a bit:

The absence at the beginning, I guess, just corresponds that things first need to be introduced with regular nouns, before they can be referred to with pronouns. Eg, “a man named Robert” has to come before “he”?

Whereas, possessives are all over the place at the start:

With “its” and “your” kind of playing foils to each other.

Breaking these out by grammatical “persons” – for the first- and third-person singulars, the possessive is always highest at the start, followed by the subject, then the object. But endings are more mixed, maybe with some interesting gender patterns – “he,” “him,” and “his” all fall off dramatically at the end, whereas “her” (as a possessive) and “my” spike up:

Meanwhile, for the third-person plural – “their,” the possessive, is super strong at the beginning and end:

And, with the first-person plurals, “our” rises highest at the end:

It’s also interesting that, for “he” / “him” and “she” / “her,” the object gradually overtakes the subject. Especially with “he” and “him,” both of which are almost exactly linear across the middle, but with “him” rising faster and higher:

So, as the narrative moves forward – things increasingly happen to people, they increasingly become grammatical objects, instead of subjects?

Punctuation

This is going on way too long, but quickly – also really zany are the punctuation tokens, which, usefully in this context, get broken out by the OpenNLP tokenizer as separate words:

Questions and dialogue happen in the middle, and endings are exclamatory:

Periods and commas also fascinate me:

The period, I assume, is basically a proxy for sentence length, where more periods mean shorter sentences? So, sentences are longest at the very beginning, and shortest just shy of the end, around 97%. I guess – long, descriptive sentences at the start, and short, staccato, action-filled sentences at the end? And it makes sense that commas would be inversely correlated – fewer periods means longer sentences, which means more commas? (And, they kiss at the end!)

Anyway, there’s sort of an infinity of stuff to look at here, and it’s hard to know where to start. I’m writing code right now to look at all of these in the context of higher-order ngrams – eg, what words are following “the” in the 99th percentile? And beyond that, I think most interesting – would it be possible to use these kinds of trends in really high-frequency words to train classifiers that could “unshuffle” novels, a predictive model of narrative sequence?

  •  

Presentation on the New Yorker

On February 6th, 2018, Nichole Nomura led a discussion about the New Yorker in the Literary Lab.

This was somewhat different from ordinary Lab meetings in that we developed multiple research questions that could benefit from the New Yorker corpus, and discussed how we want to tag and sort the corpus to facilitate answering those questions.

  •  

Presentation on “Typicality”

On February 27th, 2018, Mark Algee-Hewitt and Erik Fredner presented their new project on typicality in literature.

Do literary critics need to know what the typical novel is like? Critics routinely turn to moments where novels violate our expectations of the form, expectations that have been developed by reading, writing about, and discussing novels of all sorts. We may intuitively reject the idea of any given novel’s typicality—each is, in some sense, unlike any other—yet paradoxically rely on a conception of the typical novel as a heuristic for other works in the genre. We know when our expectations in a novel have been undercut, but in writing about a given novel, we tend to focus more on what that undercutting does than the origins of the expectation. This project shifts the critical focus from the former to the latter.

The problem of typicality poses a question that is at once deeply historical (what is the typical novel of, for example, the 1890s?) and simultaneously unmoored from history (what is the most novel-like novel?) Methods of quantitative analysis can help us get new purchase on these questions: for the first time, we can measure averages, medians, and other statistical expressions of typicality in many different ways across large datasets. But what are the benefits and consequences of thinking about the literary field in this way? How might we measure literary averages, and, assuming that we can find a few, what light would the typical novel shed on our understanding of the literary novel? In this new project, we begin to explore the intersections of quantitative and qualitative typicality as a methodological intervention into literary criticism.

  •  

The Space of Poetic Meter

One of the goals of the Techne blog as a whole is to highlight technical issues in Digital Humanities---the kinds of in-the-weeds ideas that are interesting to specialists but don't necessarily make the cut of a final paper. It's easy to think of "technical issues" as the domain of the digital half of DH; but I think it's important to emphasize the technical nature of the humanities as well. Sometimes it's easy to forget in the new and complex DH world, or just in the STEM-centric environment of U.S. academia, that humanities researchers have *technical *expertise, and DH is best served when it tries to make advances in those areas as well as finding cool new digital methods.

To that end, I wanted to discuss an issue that came up a few years ago in the course of the Transhistorical Poetry Project, an early Literary Lab collaboration that included Ryan Heuser, Mark Algee-Hewitt, Jonny Sensenbaugh, Justin Tackett, and me. It started as a technical exploration of both programming and poetics, and led us to one of the most generative ideas of the project as a whole.

The original goal of the Transhistorical Poetry Project was to automate the detection of poetic form, loosely defined. The first benchmark was detecting the number of metrical feet in each poetic line, followed by extrapolating the "metrical scheme" of a given poem (both of which depended on metrical parsing software called "Prosodic," developed by Heuser, Josh Falk, and Arto Anttila).[1] That means, in the first instance, determining that the line "The brain is wider than the sky" has four feet, and that the Dickinson poem containing it alternates between four-foot and three-foot lines:

The Brain---is wider than the Sky---

For---put them side by side---

The one the other will contain

With ease---and You---beside---

In other words, the program was basically good enough to identify ballad meter, though we mostly stuck to labeling poems as "consistent" (like a sonnet, always five feet), "alternating" (like ballad meter) or "irregular" (everything else).[2]

Just this level of detail already unlocks new ways to study poetic history; in forthcoming papers, we'll be looking at, for instance, the history of pentameter in English poetry since the 16th century. But it's instantly clear to anyone who works on poetry that the results described above are a little unusual. Standard prosody doesn't really discuss "alternating 4 and 3", much less a generic "irregular" tag. Instead, it uses long-standing terminology for the metrical patterns within lines; sonnets, for example, are in iambic pentameter.

Since several of the members of the project work on poetry, we were especially curious about how our results could interact with four of the most common meters: iambictrochaicanapestic, and dactylic. We don't pretend that these are the only or best ways to categorize meter in English; but to us the balance of critical usage, and the poetic practice influenced by that usage, makes these categories worth exploring on their own terms.[3] In other words, we wanted to engage with the technical questions raised by ordinary prosody.

The first step, technical in the metrical sense, is to determine how these feet relate to each other. Essentially, they can be sorted by two criteria: 1. Does the stress come on the first part of the foot, or the last? 2. Does the foot have two beats, or three? These questions organize the feet like so :

Figure 1

(I couldn’t think of an anapestic animal.)

The next step, technical in the digital sense, was to operationalize these criteria. That is, on a programmatic basis, how can we tell: 1. Whether a foot is head-initial (falling) or head-final (rising)? 2. Whether a foot is binary or ternary?

Prosodic is pretty good at detecting which syllables in a line are stressed, which is the key to question one. Lines with a head-final rhythm should, generally speaking, start with an unstressed syllable, whereas lines with a head-initial rhythm should start with a stressed one. However, trochaic inversions are common enough that they could throw off the calculations for many poems that a human reader would call iambic. To get around that, we asked Prosodic about the fourth syllable in each line. This worked well, as you’ll see below, though it changes up the square a little.4 For question two, we simply check the frequency (in percentage terms) of consecutive weak syllables. Since ternary meters have two unstressed syllables per foot and binary meters only have one, we should see far more consecutive weak syllables in ternary meters.5

To test how well these operations worked, we assembled 205 poems that fit comfortably in each of the four meters—that is, they were consistently iambic, anapestic, etc. Sensenbaugh, Holst Katsma, and Zoya Lozoya scanned each of these poems line by line to confirm their metrical regularity. The colors in Figure 2 reflect these initial metrical tags.

Figure 2

The lines that cut the graph into quadrants are based on empirical observation; they divide the space in the way that maximizes the machine's accuracy relative to the initial tags. That accuracy is remarkably high: In this sample, we correctly classified 202 of the 205 poems, or 98.5%.[6] Even the borderline cases are often successes here: Richard Crashaw's "Upon the Infant Martyrs", for example, lies exactly between the iambic and trochaic quadrants; its first two lines are perfectly iambic, and its second two lines are perfectly trochaic:

To see both blended in one flood,

The mothers' milk, the children's blood,

Makes me doubt if heaven will gather

Roses hence, or lilies rather.[7]

At the beginning of the project, we joked that we wanted Prosodic to be as accurate as an undergraduate, and we feel that we succeeded---either inspiring or depressing, depending on your perspective.

At the same time, Crashaw's poem is exemplary of a key lesson from this graph. I've been speaking of the division of poems into four metrical categories, but there are not four positions here; there are hundreds, nearly as many as there are poems. Tennyson's "Lady of Shalott"  and Byron's "She Walks in Beauty" may both be iambic, but they clearly differ from each other according to the criteria we used to determine their iambic-ness---the distance between the two is substantial, even within the iambic quadrant. The "categories" are far more nuanced than four simple designations; to be precise, what we have here is a metrical space.

When we turned our attention to a larger archive of poems, we serendipitously discovered a new way to think about this metrical profusion:

Figure 3

Every dot is a poem; there are 6,400 in total on this graph. From these, we selected 238 at random and scanned them by hand; our conclusions are reflected in the colors you see here. Compared to our human tags, the program correctly identified 94% of poems.

With even more metrical variety in front of us, we noticed one poem the graph doesn't categorize. At the center of the dividing lines, sitting in none of the four quadrants, is Thomas Hood's "Lines to Miss F. Kemble, On the Flower Scuffle at Covent Garden Theatre," a comic poem published in 1832 in the Athenaeum. As it happens, this poem is maniacally unmetrical (or perhaps it's the more philosophical "ametrical")---even moreso than the free verse poems in our sample (in black), which often displayed a particular metrical tendency, even if "accidental." Here is the first stanza:

Well---this flower-strewing I must say is sweet

And I long, Miss Kemble, to throw myself considerably at your feet;

For you've made me a happy man in the scuffle when you jerk'd about the daisies;

And ever since the night you kiss'd your hand to me and the rest of the pit, I've been chuck full of your praises!

The rest of the poem (available here) continues very much in the same vein, structured by rhyme but hilariously difficult to read with any metrical regularity.[8] And this is just the exemplar of a general rule: If a poem is perfectly metrical according to these classical feet, it shows up near the corners of the graph---a perfectly trochaic poem will never have an accented fourth foot or two consecutive weak syllables. If a poem is all over the place, like Hood's, it will show up near his. If it is somewhere in between---like most poems---it will appear in the space between. And we find this to be true, empirically; the closer a poem is to the center, the more apt it is to be free verse or some other irregular form. Thus the Hood Distance of a poem---literally its distance from Hood's "Lines to Miss F. Kemble" on this graph---is a measure of the extent to which it exhibits the characteristics of one of these four basic feet, *but not the others---*that is, its metricality, or metrical regularity.[9]

On one hand, Hood Distance is a great example of a lesson that we encounter again and again in quantitative literary criticism: Things tend not to just be A or B, but to be some percentage A or B. That's what a trochaic inversion, for instance, really indexes in the first place---most sonnets aren't 100% iambic (or, in a sense, 100% sonnet). This graph gives us a way to see meter in particular not as a quality (either iambic or trochaic) but as a space of possibilities.

On the other hand, we believe that Hood Distance amounts to more than added nuance for an existing concept. It articulates a new concept, the range of formal variation from poems with a strongly defined base meter (like iambic ballads) to those with no particular base meter at all (like free verse poems). In short, Hood Distance means that the metricality of a poem, in this complex metrical space with its hundreds of realized possibilities, can be measured. We can track the history not just of things like pentameter, or even iambic pentameter, but metricality in general---the tendency of the poems of an era (or at any rate, the poems we can get from an era) to adhere to the prosodic rules that evolved alongside them. For example, here is the variation in Hood Distance we see over the course of some of the eras tagged in the Chadwyck-Healey poetry corpus:

Figure 4

Each dot here is a poem; the gray bars contain 50% of the poems in a given era, and the spot where they change color is the median Hood Distance for that era. The colors of the poems reflect the traditional, categorical designations of meter, but the changes in the distribution, the rise and fall of the median, show a new kind of poetic history: The rise and fall of metrical regularity. Starting in the Tudor period, Hood Distance increases through the eighteenth century; the Romantic Era then initiates a decline in regularity that persists as long as the data does, as clearly iambic and trochaic poems give way to more freewheeling meters. Like so many DH findings, this tracks roughly with what we "already knew"---but did we know it? Are you sure you wouldn't have picked the Augustan Age for peak regularity? What would you have said about the Victorian Era as against the Restoration? If knowledge is (more or less) true justified belief, we now have more empirical justification and a more precise sense of the truth, where neither were quite as possible before.

In the end, Hood Distance gives us a new lens for measuring a technical feature of poetics on the scale provided by digital research. And conceptually speaking, Hood Distance is not the only thing we can measure this way. In theory, we could track the distance from any poet, defining meter in terms of, say, a Dickinson distance. Or we could change the axes, putting, say, Hood Distance itself on one, and the percentage of line-ending rhymes on the other, to measure the license that rhyme gives (if any) to metricality. Meter is a complex structure that has varied widely in theory and practice over time, but this concept of spatial arrangement derived from programmatic analysis of thousands of poems enables us to construct frameworks for describing poetic history with the usual DH mixture of the very broad and the very specific. It's the D and the H as a dialectic; this metrical space is the synthesis of two kinds of technical exploration.

Notes

1 Ryan Heuser, the primary programmer during this project, has written two approachable summaries of Prosodic for those who wish to use it, one more specific to this project, and one (more frequently updated) for more general use. For a more linguistics-oriented introduction to the software, see: Anttila, Arto, and Ryan Heuser. "Phonological and Metrical Variation across Genres." Proceedings of the Annual Meeting on Phonology 3 (2016). Web. Linguistic Society of America. Washington D.C., 2015. The paper is available here.

2 I wanted to use the more thematically-appropriate "Split the lark and you'll find the music", but it's more typically Dickinsonian---i.e., too irregular to serve as an example of "perfect" meter.

3 We thought of including other feet, but as Jonny Sensenbaugh writes: "Although other classical metrical feet such as the spondee and the amphibrach exist, the existence of truly spondaic poems is doubted in linguistic theory (*Princeton Encyclopedia of Poetry and Poetics, *1352), and that of English amphibrachic poems both exceedingly rare and difficult to distinguish from anapestic or dactylic meter (45)".

4 Iambs and dactyls are stressed on the fourth syllable (-/-/ and /--/, respectively), whereas trochees and anapests are unstressed there (/-/- and --/-, respectively).

5 Here's a simplified explanation showing why this works: In Prosodic, a perfectly iambic line (with, let's say, four feet) would read "w-s-w-s-w-s-w-s"; a perfectly trochaic line would read "s-w-s-w-s-w-s-w". The "w-w" pair (the minimum unit of consecutive weak syllables) never appears in either line; even if an iambic or trochaic poem had a "mistake" here or there, that "w-w" pair would still be relatively rare. Compare a perfect anapestic line, "w-w-s-w-w-s-w-w-s-w-w-s", or a perfect dactylic line, "s-w-w-s-w-w-s-w-w-s-w-w". These are rife with the "w-w" pair, and even with variations here and there in the poem, the pair should still occur frequently.

6 On a line-by-line level, the accuracy was lower---59%. The accuracy for a poem as a whole, however, depends only on getting most of the lines right, so two or three lines of a sonnet can be mischaracterized as trochaic and the program will still place the poem in the iambic quadrant. In a loose sense, then, the overall metrical scheme of the poem influences the "interpretation" of individual lines---not too dissimilar from human reading.

7 Note that in British poetry of this period, "heaven" is usually treated as a one syllable word.

8 Note the italicized "is" in the first line. To a human, the italics probably indicate that the word is stressed; Prosodic, though, does not see typeface. To my ear, the poem also follows a loose ballad meter, with the 4/3 beat structure rendered as 7 stresses per line---but it is so irregular that it does not match very well with any of the four metrical feet Prosodic tracks. These are just two examples of metrical complexity that our project does not capture.

9 Properly speaking, the most accurate measure would be a Hood Vector. Vectors include information about direction, so they would show whether a poem was far from Hood by virtue of occupying the iambic corner, the dactylic corner, the boundary between anapest and dactyl, etc. With this accuracy, however, comes a tradeoff in ease of understanding and use; e.g., although we can envision Hood Distance as a very promising pedagogical tool in explaining how meter works, it loses some of its appeal if English students are expected to calculate vectors.

  •  

Presentation on “Operationalizing the Change. Literary Transition in Poland Viewed Through Bibliographical Data (1989-2002)”

On March 13th, 2018, Maciej Maryl presented his work on literary transition in Poland from 1989-2002.

Operationalizing the Change. Literary Transition in Poland Viewed Through Bibliographical Data (1989-2002)

I will be presenting preliminary results of the quantitative research into transitions of Polish literary life 1989-2002. The abundance of scholarly and critical writing about this period makes it interesting from the perspective of data-driven research, allowing for validation of critical claims on the basis of the existing data. I will focus on operationalising and plotting key qualitative hypotheses about this period, namely dispersion and recentralisation of literary life after 1989, debut-centrism of the literary criticism in the early 1990s and the subsequent “return of old masters” in the second part of the decade.

The research is based on the Polish Literary Bibliography, a comprehensive database of Polish literary and cultural life, which indexes not only literary books but also other instances of literary life and reception. The bibliographical dataset I compiled for this study includes metadata about 24,025 writers and poets, 22,503 critics, 188,633 creative works (incl. 37,294 books) and 90,539 critical writings (e.g. reviews, interviews, profiles). Since big datasets tend to cause big problems, this talk will also address the pitfalls of data provenance.

Maciej Maryl, Ph.D., assistant professor at and the founding head of the Digital Humanities Centre at the Institute of Literary Research of the Polish Academy of Sciences. He chairs a COST action New Exploratory Phase in Research on East European Cultures of Dissent and coordinates the data project: Polish Literary Bibliography – a knowledge lab on contemporary Polish culture. He is also involved in DARIAH Digital Methods and Practices Observatory WG (DiMPO), ALLEA E-humanities Working Group, OPERAS Core group, and OpenMethods Editorial Board. He is currently a Fulbright Visiting Scholar at Stanford Literary Lab.

  •  

Presentation on “Reading the Norton Anthologies of American Literature”

On May 7th, 2018, J.D. Porter and Erik Fredner presented "Reading the Norton Anthologies of American Literature”.

As one of the most prominent commercial literary anthologies and a pedagogical tool commonly used at both undergraduate and graduate levels, Norton has been in the business of binding literary canons for more than half a century. How, then, has Norton constructed its literary canon, and how has it changed over time? This project analyzes every text and excerpt selected for every edition of the Norton Anthologies of American Literature (NAAL) published to date. We explore the trajectories not only of individual authors and works, but broader trends of inclusion and exclusion in the Norton’s canon. Finally, this project reflects more generally on the 20th century construction and renovation of the American literary canon, focusing not on the well-known interventions of the early 20th century that canonized writers like Melville and Hawthorne, but rather on the representation of the American literary canon since 1979, when the first edition of the NAAL was released.

  •  

Presentation on “Identity”

On April 9th, 2018, Mark Algee-Hewitt, J.D. Porter and Hannah Walser presented their latest work on the Identity Project.

“Representations of Race and Identity in American Fiction” explores the changing discourse of identity in the American Novel from the late eighteenth to the early nineteenth century. As the project moves toward publication, we wanted to share our latest work with the lab, including new visualizations of the discourse of the novel and a new set of findings on the “stickiness” of identity labels that have shifted the goals and outcomes of the research. We are particularly eager to think through the implication of these findings with the lab before we submit the piece for publication.

  •  

Presentation on “Microgenres”

On May 31st, 2018, there was a presentation from the Microgenres group.

In this project, we explore the discursive inter-disciplinarity of novels, using machine learning to identify points at which authors incorporate the language and style of other contemporary disciplines into their narratives. How do authors signal the shift between narrative and, for example, history, philosophy or natural science? And do these signaling practices change with time or with discipline? Akin to what Bakhtin terms "heteroglossia," these stylistic shifts indicate not only the historically contingent ways that novels are assembled from heterogeneous discourses, but they also shed light on the practices of disciplinary knowledge itself.

Participants: Mark Algee-Hewitt, Michaela Bronstein, Abigail Droge, Erik Fredner, Ryan Heuser, Xander Manshel, Nichole Nomura, JD Porter, Hannah Walser

  •  

Popularity/Prestige: A New Canon

Shortly after the Lab released my recent pamphlet on the structure of the literary canon, New York magazine ran an article about the 21st century canon, in which a panel of judges pick an early version of the literary canon from the century so far.[1] The structure of their canon is a list, approximately 100 books published (mostly) since 2000---but I wondered how it would fare under the terms laid out in the pamphlet. How does the New York canon look when it comes to popularity and prestige?

The basic idea behind the pamphlet is that literature becomes canonical in a variety of ways, and a structure like a list can't always capture the complexity of the canon as we actually encounter it. The two metrics I picked to remedy this are designed to show us an arrangement of the canon based on things that academic scholars write about (prestige, at least one version of it) and things that many people know about (popularity). This helps us to understand how, say, Gertrude Stein (very prestigious, less popular), Stephen King (very popular, not as prestigious), and Jane Austen (both) relate to each other within our broader notions of canonicity. But what can it tell us about, say, Zadie Smith, W.G. Sebald, and Roberto Bolaño?

I think my version of popularity applies pretty smoothly to the New York list: I use the number of ratings each author has on Goodreads, basically an index of how many users have interacted with the author at all. Prestige is much trickier. In the pamphlet I use the number of academic articles that feature each writer as a primary subject author (i.e., they're tagged as being highly featured in the article), according to the Modern Language Association's database of literary scholarship. I imagine this is not the kind of prestige the New York panelists care about. They're writers, editors, and critics rather than academics, so they probably aren't deeply invested in the goings on at scholarly journals. It's also not clear that MLA scores can tell us much about recent work; academia moves notoriously slowly, and it can take two years or more to get from a paper idea to a publication---so any book published after about 2016 will have had very few chances to appear as the subject of an academic journal. In this case, though, I think these caveats make things more interesting, because they give us a chance to measure one kind of canon (made by people more or less in the contemporary writing business) in terms of another kind (a slower-moving and more academic one).

There's one other major difference between the New York canon and the one I use in the pamphlet. They chose books; I worked with authors. Since I was trying to cover a wide variety of genres over a very long time span, authors made life a lot easier; Shakespeare, Dickinson, and Hurston struck me as somewhat more comparable to each other than Hamlet, "Because I Could Not Stop for Death", and Their Eyes Were Watching God. During the research phase, though, I did try the method on individual books, which led to some interesting depictions of individual authors, each of whom has a characteristic canonical bookprint. For instance, figure 1 shows Joyce, Austen, and Dickens (note that the axes are logarithmically scaled).

Figure 1

Joyce is extremely prestigious, albeit with most of the criticism about him allocated to one book. Austen is substantially less prestigious, but much more popular; modern Goodreads users still love Pride and Prejudice (even in comparison with today's novels). Dickens as he appears here has achieved Austen-like canonicity, but only in the top half of his output; he also has an entire Austen-sized corpus with distinctly less-than-Austen results. As an author, he has greater total prestige than Austen, in part because he produced so many novels for scholars to analyze; but on the level of individual books, her works tend to surpass his.

After all of that preface, let's get to the results for the *New York *canon. We can start with Figure 2, which uses non-logarithmic axes in order to make the outliers clear.

Figure 2

Readers are very familiar with Gillian Flynn's Gone Girl, which is beating every other book depicted here by over one million ratings (none of the others even has one million ratings). Meanwhile, W.G. Sebald's Austerlitz is, by a pretty sizable margin, the most prestigious book, having netted 258 academic articles.[2] The clear difference between the two speaks to the usefulness of the graph. If you took a negative view of these choices, you might say Gone Girl can't make the canon because it's a flash in the pan (no one takes it seriously) or Sebald can't because he's obscure (you can't be canonical if most people have never heard of you). Yet they're clearly both quite successful, along their particular tracks. Cormac McCarthy's The Road splits the difference---a book well known enough to, say, become a successful movie, but also by a Famous Important Writer.

Turning to a logarithmic depiction, in Figure 3, gives us a clearer picture of the overall structure of this canon.

Figure 3

The gray lines here reflect the median values for both prestige and popularity. It's immediately clear that most of these books have received fairly little academic attention, even when we think of them as pretty prestigious. Leaving the Atocha Station, for instance, is highly regarded (it was widely praised and won some awards), yet I have personally met 25% of the people who have published MLA-recognized articles about it (his name is Alexander Manshel; he's a Lit Lab member).[3] In fact, 35 of the books listed, or a little over a third, have no MLA articles at all. That means (and for me this rings intuitively true) that getting any scholarly attention is a very strong positive signal for books published in the last 18 years.

This is in part a function of time, for the reasons mentioned above. As Figure 4 shows us, the MLA number is highly contingent on the book's publication date.

Figure 4

In fact, this effect is even more pronounced than I expected: The big drop-off starts ten years ago. This points to another major (and, I suppose, obvious) difference between academic thinking about literature and that of an institution like *New York *magazine. In an English department, most people work on old literature; you'd virtually never see a department that had a majority of its faculty working on the contemporary. New York, by contrast, probably does not employ any medievalists. Over time, this means that academics are more likely to keep talking about the same things over and over, with a rich-get-richer effect. Whoever the Ian McEwan of 1895 was, New York is unlikely to mention him much these days. Meanwhile Hamlet has accrued 2,169 articles since 2000---399 more than everything in Figure 4 combined.

There's a conspicuous absence in the graphs so far, however, and addressing it helps to close that gap quite a bit. The New York editors included several book series in their list, like Elena Ferrante's Neapolitan novels or N.K. Jemisin's Broken Earth trilogy. I didn't include those in the images above, because I wasn't quite sure how to show them. Here's the original, non-logarithmic image, with every novel from each series included.

Figure 5

In prestige terms, Margaret Atwood's Oryx and Crake (part of her MaddAddam trilogy) is the big addition, coming in third overall. But an even more striking story is clearly Harry Potter. I'll admit that when I first heard about the New York article, Harry Potter was my first thought---inspired, most likely, by J.K. Rowling's incredible popularity in the data for the pamphlet. The Potter series here has 18.2 million Goodreads ratings; the entire non-Potter corpus has 7.7 million. Some of that is recency; as I note in the pamphlet, the best-sellers of 1918 are mostly forgotten today, so popularity in 2018 might be equally ephemeral, if we're trying to project forward. But the first Potter novel is actually the oldest book on this list (it came out about a decade before Goodreads existed), and it has 5.6 million ratings by itself. The numbers just confirm what we all know---these books were the major popular literary event of the century so far.

Oddly enough, the New York panel almost didn't include them. They divided their list into four tiers: Best Book of the Century (So far); 12 New Classics; The High Canon (books chosen by at least two panelists); and The Rest. The first tier only contained one book, Helen DeWitt's The Last Samurai (no relation), which is actually in the southwest, least canonical quadrant here, with 4,105 Goodreads reviews and 1 MLA article. I'll admit that I found their choice of that novel pretty surprising; maybe this is an index of some pretty substantial institutional differences in literary consecration. Still, it's worth remembering that making a list like this is often more an exercise in canon creation than in canon reflection. I think in DH and other empirical literary critical fields, we often think of the canon as something out there in the world for us to study, which it is; but as in many other fields, observation changes the object. For the New York panel, this way of thinking about things was probably pretty paramount. You don't necessarily pick Ghachar Ghochar because you think it has had a significant impact on (English language) literary culture; you pick it because you want it to.

Perhaps as a result of motivations like these, the Harry Potter series made the last tier, meaning, I suppose, that only one person picked it. Could this be a prestige problem? Perhaps; I recall presenting my earlier Pop/Pres data for a French audience, and most of them scoffed at the prospect that any French academic would ever write about someone like Rowling (perhaps she should have tried professional wrestling). Yet Figure 5 shows that she's right up there with all sorts of prestigious novels; the first Potter novel is beating The Corrections and three books by J.M. Coetzee.

Of course, Harry Potter and the Philosopher's/Sorcerer's Stone came out in 1997, early for this canon; but there's another factor to consider, too, the one that kept me from including series in the original images.[4] The Potter titles sum to 137 MLA articles---respectable, but less than AusterlitzThe Road, or Oryx and Crake. If you just look up "Harry Potter", though, (with Rowling in another field, so we're not getting just any Harrys or Potters), you get 775 MLA articles.[5] In other words, more people are writing about the Harry Potter series than about any one of the novels (or about any of the rest of these books) by a substantial margin. It's a bit like Sherlock Holmes; scholars might write about Hound of the Baskervilles or The Speckled Band, but often they just write about Holmes himself. The literary contribution is not well captured by any particular publication---which makes it difficult to depict on a graph.

Nonetheless, in prestige as in popularity, Rowling is crushing it. Figure 6 is an attempt to depict each series as a single collective point; it receives the sum of the Goodreads ratings for each constituent book, plus whichever MLA score is higher between A) summing the individual volumes or B) looking up the series as a whole (using both would risk double counting articles). This isn't quite fair to the other books on the list; after all, it's surely easier to amass Goodreads ratings from your fans if you give them multiple books to rate. Nonetheless, the results are pretty stark. Seen this way, the MaddAddam trilogy is approximately as canonical as The Road, and the Harry Potter series is by far the most canonical thing on the graph---in the pamphlet, I came to think of that space in the top right corner as the Shakespeare Position. In this company, Shakespeare is clearly J.K. Rowling.

Figure 6

If you're like me, the fun part of all this is speculating about how this canon will age. What will the literary scholars of 2118 make of this period, or this list? I have my non-quantitative opinions, of course, often about things that didn't make the New York list.[6] I also don't think this way of measuring canonicity can offer much of a negative signal, especially given the time constraints. Helen Oyeyemi and Valeria Luiselli seem like strong candidates for the canon to me, but their work is too recent to be sure (that's not just a problem with these graphs, of course---recent work is always more difficult to evaluate for the longue durée). Moreover, many metrics are just not captured here, or not capturable. I find myself thinking about Marlon James's A Brief History of Seven Killings pretty often, and it's not quite in the northeastern, most canonical quadrant yet; I understood the most recent U.S. Open entirely differently, in real time, because of Claudia Rankine's Citizen---how do you measure an effect like that?[7]

Still, I think we can take some positive signals from what we see here. Austerlitz is in great shape; this accords pretty well with my sense of Sebald's uptake among academics. It may also be noteworthy that he made this list in spite of writing in another language; there are only a few such cases here. That could be a good sign for 2666; add Bolaño's global reach to the information here, and his work looks formidable. McCarthy's Road is doing so well that I have to imagine it will persist for a while. For me, though, since I'm unfamiliar with the series, the *Oryx and Crake *results were the most surprising. In a way, Atwood has already begun to stand the test of time; The Handmaid's Tale came out thirty years ago, and it clearly still has an impact today. Atwood is well positioned to stay put in the Northeast quadrant.

And of course there's Harry Potter; I think those novels are already in, for the same reason Sherlock Holmes made it one hundred years earlier. At a certain point, you're so popular that people can't avoid talking about you, even if only to try and understand your popularity. If you look back at Figure 3, the New York selections are concentrated in two places: In the Northeast, canonical quadrant, and scattered along the "no MLA articles" axis at the bottom. Much more than in the broad literary canon depicted in the pamphlet, the recent canon unites popularity and prestige---to get one, you really need the other. In a few cases I think various kinds of prestige probably led the charge (e.g., with Ngũgĩ wa Thiong'o's Wizard of the Crow, which has only 2,106 Goodreads ratings, but has already amassed 46 MLA articles.) Typically, though, it appears that readerly attention is something of a precursor for critical attention; when something is widely read (and it's clear that reading happens much faster than academically analyzing), scholars are more apt to take notice. Harry Potter is a kind of apotheosis of that principle. We can't know who else will make the canonical library, but when they arrive, Hermione will have gotten there first.

Notes

1  Note that the link is to Vulture rather than to New York per se (the two are connected in some corporate structure or another). It's tempting to call this the "Vulture Canon", but I first encountered it in the print version of *New York *magazine, and I like the way "New York" suggests the world of professional writers/critics/editors in question, so with some regrets I'll use "New York Canon" in this post.

2  It's a little more difficult to look up books than authors, since titles often consist of common words (e.g., Ali Smith's How to Be Both). Minor differences also matter more at this scale than they did in the pamphlet---being off by two articles is more significant for a book with 10, in comparison with an author who has 6,000. My method was to start with the title in the Primary Subject Work field, and the author's last name in a general field. I also tried titles in the original language where applicable, and in a few cases titles in the general field. As a rule I tried to give a book the maximum plausible number of articles I could find. I spot-checked the results; I think they will generally hold up, but it's always possible I missed something.

3  You can read Manshel's article here.

4 * The Corrections* came out in 2001, and one of the Coetzee novels (Boyhood) is also from 1997, so Rowling doesn't have *that *much of a head start over those two.

5  Readers of the pamphlet may notice that this is about 50% more articles than Rowling had as a whole in that data. That's because that data was a few years old; the information in this post was collected in October 2018.

6  Here's a self-indulgent footnote: I'd have included Harryette Mullen's Sleeping with the Dictionary, César Aira's An Episode in the Life of a Landscape Painter, Allison Bechdel's Fun Home, Toni Morrison's A Mercy, and Cixin Liu's The Three Body Problem trilogy.

7  In general, non-novel genres suffered here, probably because they don't attain their peak audiences or critical attention through the book format. Frederick Seidel and Fred Moten are trapped in the least canonical quadrant, but that doesn't mean much about their poems. And for my money Anne Carson seems destined for enduring canonicity, but The Beauty of the Husband doesn't quite capture what she's up to.

  •  

Presentation on “Novel Worldbuilding”

The created worlds of novels exist on the borders between mimesis and invention, pulling from the real-world experience of the author and her readers to create a fictionalized setting for plot, theme, and narrative. But as the worlds built by authors become less reflective and more inventive, particularly in twentieth-century genres like Science Fiction and Fantasy, the strategies the author employs to educate her readers on the rules of the newly-invented world while maintaining the flow of narrative change accordingly. In this project, we explore the narrative techniques and microgeneric shifts that allow authors of genre fiction to simultaneously create and communicate invented worlds.

  •